
Download

Precision P = TP TP+FP' 1 Recall = TP TP + FN' 2 F1 = 2 PR P+R' 3 ACC = TP+TN TP+FP+TN+FN' 4 

N total = r N front + N back 5

RESEARCH ARTICLE
Yield and maturity estimation of apples in orchards using a 3-step deep learning–based method
Xinxing Zhang1, Zhuping Song2, 3, Qianyue Liang2, 3, Shumin Gao2, 3*
1Department of Mechanical and Electrical Engineering, Quzhou College of Technology, Quzhou, China;
2College of Engineering, Huazhong Agricultural University, Wuhan, China;
3Key Laboratory of Agricultural Equipment in Mid-lower Yangtze River, Ministry of Agriculture and Rural Affairs, Beijing, China
Abstract
Yield and maturity estimation of apples in orchards before harvest is essential for labor resource management. Current yield and maturity estimation are usually manually conducted, which is neither accurate nor efficient. In this paper, a 3-step deep learning–based approach for yield estimation and maturity classification is presented to address these issues. The proposed framework included an optimized detection network to count the visible fruits from both sides of a tree, a classification network to filter out mis-detected objects and perform maturity estimation, and a fruit load estimation algorithm to obtain the total fruit count of a tree. Images from three different apple orchards were collected to evaluate the performance of the proposed method. According to a series of comparative experiments, the proposed method outperformed several detection networks regarding the counting accuracy, indicating that an optimized architecture of the detection network combined with a fine classification network is necessary for enhanced precision of yield estimation. The presented workflow can be readily extended to other fruit crops for automation yield and maturity estimation featuring high efficiency and accuracy.
Key words: deep learning, image analysis, maturity estimation, yield estimation
*Corresponding Author: Shumin Gao, Key Laboratory of Agricultural Equipment in Mid-lower Yangtze River, Ministry of Agriculture and Rural Affairs, Beijing, China. Email: [email protected]
Received: 13 November 2021; Accepted: 19 February 2022; Published: 29 April 2022
© 2022 Codon Publications
This is an Open Access article distributed under the terms of the Creative Commons Attribution-NonCommercial-ShareAlike 4.0 International (CC BY-NC-SA 4.0). License (http://creativecommons.org/licenses/by-nc-sa/4.0/)
Introduction
In-filed yield and maturity estimation of fruits before harvest is essential for labor resource management. Commonly, growers need to estimate the yield of fruits in the orchard by sampling a few trees at random, and the maturity of fruits is extrapolated based on experience; however, these methods are neither accurate nor efficient. On the other hand, precision agriculture techniques have attracted increasing attention in recent years, showing potential for a wide range of agricultural tasks in orchards including fruit diameter estimation (Costa et al., 2021), disease detection (Liu et al., 2018ab; Pan et al., 2021) maturity approximation (Mesa and Chiang, 2021), automated pruning (Long and Schupp, 2018), and fruit picking (Kang and Chen, 2019, 2020); detection and classification of fruits on the trees is one of the precursors to these tasks. Therefore, we aim to develop automated fruit detection and classification tools for yield and maturity estimation in this study, which can also be further adopted for other precision agriculture tasks in future work.
Previous research to automate the yield estimation process usually adopts thresholding techniques combined with color or shape characteristics, which can perform fruit detection in controlled environments (Otsu, 2007; Zemmour et al., 2019). One solution to operate this type of systems at night is to introduce artificial flashlights (Wang et al., 2013), and the resulting binary masks are characterized as fruits using static features predefined. However, the limitations of these systems are often associated with additional sensors such as near-infrared (NIR) or thermal cameras, which complicate the setup. Moreover, it is challenging for these systems to obtain stable detection results in orchards due to the complex environments such as illumination changing (Wan and Goudos, 2019) and background variances (Tu et al., 2020).
The development of machine-learning algorithms provides the possibility to realize fruit detection and classification in orchards using only an RGB camera, significantly improving the applicability and compactness of automated systems for yield estimation. Das et al. (2015) adopted a support vector machine for the classification between fruit and background on each image pixel, and they fitted a linear model to compensate for the miscounted fruits. In one study, a Gaussian mixture model (GMM) was used for both fruit detection and classification, yielding high accuracy up to 91.98–94.81% (Roy et al., 2019). However, these techniques still rely on predefined features such as color, morphological, and texture characteristics (Bandi et al., 2013). Since these features are hardly invariant to complex imaging conditions such as translation, rotation, and scale, and different lighting conditions in orchard environments, the generalization of these techniques is not satisfactory.
In more recent years, deep learning–based methods have become state of the art in computer vision tasks, proven to be effective for various domains including agriculture (Chen et al., 2021). As the networks can learn features from the huge amount of training data that might be generalized across environment variances, enhanced accuracy and robustness can be expected. Fruit detection can be realized using either semantic segmentation networks (Badrinarayanan et al., 2017) or object-detection networks (Nasiri et al., 2019). The former assigns each image pixel to a class (fruit/environment), which has been adopted to detect mangoes using Faster R-CNN (Bargoti and Underwood, 2017) and apples using U-Net (Hni et al., 2020). The latter can localize and classify the targeted objects simultaneously in an input image, with relevant applications of yield estimation for kiwifruits (Fu, 2020), apples (Apolo-Apolo et al., 2020), and strawberries (Chen et al., 2019). The network outputs are then summed up as the fruit counts in each image, but accurate counting is still challenging due to mis-counts during detection. Alternatively, Chen et al. (2017) combined two networks for better counting accuracy. A fully convolutional network was first adopted to generate the feature maps of possible targets, and a CNN network then performed fruit counting using a regression head. Fruit maturity estimation has also been investigated as a classification task using deep learning–based methods (Garillos-Manliguez and Chiang, 2021; Nasiri et al., 2019), with the results usually outperforming those using traditional computer vision techniques (Faisal et al., 2020). However, research to perform yield and maturity estimation of fruits at the same time in orchards is limited.
In this work, we present a deep learning–based method to perform automatic in-field fruit yield and maturity estimation. Particularly, we aim to achieve two improvements compared with those reported in the literature: (i) enhanced counting accuracy and (ii) yield and maturity estimation at the same time. The proposed method included two network models, an optimized detection network and a refined classification network. The detection network detected and localized the fruits within the collected images, and the classification network then filtered out mis-detected objects and classified those detected fruits into mature and immature ones. A fruit load estimation algorithm was also developed to estimate the number of fruits of each tree using the images from both sides. As a case demonstration, we collected images from three apple orchards to evaluate the performance of the proposed method, and the method is readily extensible to other fruit crops.
The rest of the paper is organized as follows. Section 2 introduces the development of the dataset, including image data collection, augmentation, and labelling, and Section 3 includes the details of the proposed method consisting of a detection network, a classification network, and a load estimation algorithm. Section 4 presents the experimental setup and results, and the conclusions are included in Section 5.
Materials
Image collection
As shown in Figure 1A, image collection was performed from three apple orchards located in Qingdao, Shandong province, China, from September to October in 2020. This time period started about 6 weeks prior to the harvesting season and ended when most of the apples were commercially mature, during which apples at different maturity levels could be observed. As shown in Figure 1B, the apples photographed 6 weeks before harvesting were generally pale, and they turned bright red 2 weeks later. To include different illumination conditions in the dataset, image collection was performed with different lighting conditions, including cloudy, semi-cloudy, and sunny conditions, at three shifts of the morning, noon, and evening. For each tree, one image was taken at its front side and another image was taken at its backside, and the view angle was also randomly set to enhance the generalization of the dataset. In-field imaging was performed using an Intel RealSense range sensor D-435i with the imaging resolution of 1920 × 1080 and an RGB camera with the same image resolution. To match the images from both sides to the corresponding tree, we numbered each tree first, and the images taken were then named according to the tree number. Overall, a total of 944 images of 472 different trees from these orchards were obtained.
Figure 1. (A) The images of apple trees from three different orchards. (B) The apples at different maturity stages.
Image data labelling
We labelled the image data sent to the detection network and classification network separately. Firstly, the images were sent to the detection network to detect the apples within the working scene, and the collected images were resized to 480 pixels × 414 pixels to match the input size of the detection network. For the ease of the comparison of our model with other state-of-the-art (SOTA) networks, we labelled these images in PASCAL VOC format that included the detection results and their bounding box location using the LabelMe tool. To avoid training errors due to insufficient or unclear image features, we only labelled the apples with the size larger than 32 pixels × 32 pixels. Then, for the classification image data, we cropped the image region of each detected apple by using the location information from the detection labels. Three human experts independently labeled each classification image into three classes, including mis-detected objects, mature apples, and immature apples, and the ultimate class of the image was identified as the one that all of them agreed with. All classification images were resized to 112 pixels × 112 pixels before they were fed into the classification network. As a result, there were 944 detection images and 2400 classification images for network training. Among the classification training images, there were 1172 images that were immature apples while the rest of images were mature apples. We used 50% of the data as the training dataset, 25% as the validation dataset, and the rest 25% as the test dataset.
Image data augmentation
Image augmentation plays an important role in improving the accuracy, robustness, and generalization of the network training (Zhao et al., 2018). Although we included images with different illumination conditions, weathers, and view angles in the collected dataset, they still could not completely replicate the complex environment in orchards. To further improve the robustness of the network models, multiple image augmentation operations were introduced during the training procedures of the network models.
Augmentation on detection images
The detection network was required to detect and count all the fruits on a tree from the input image. As for image augmentation operations, we applied image color adjustment in the HSV color space to adjust the brightness, color saturation, and contrast of an image, which simulated the appearance variances of the apples in different illumination conditions. Moreover, to simulate the apple appearance variances due to different distance and view angles, image crop, resize, rotation, and translation were used during data augmentation as well. Details of the image data augmentation operations adopted for the training of the detection network are summarized in Table 1.
Table 1. Image augmentation operations for data processing of the detection network.
| Operation | Description | Strength |
|---|---|---|
| Brightness | Adjusting image brightness | [0.1, 0.9] |
| Translate-X | Translate image along X-direction | [–150, 150] |
| Translate-Y | Translate image along Y-direction | [–150, 150] |
| Color | Adjusting the color saturation | [0.1, 1.9] |
| Crop | Cut out square regions of the image | [0.60] |
| Rotate | Rotate the image | [–30, 30] |
| Sharpness | Adjusting image sharpness | [0.1, 1.9] |
Augmentation on classification images
After detection, a classification network was applied to filter out the mis-detected objects and classify the correctly detected fruits into mature or immature cases. We also applied several image augmentation operations in the color space, including adjustment in brightness, contrast, and color saturation. Image augmentation operations in the geometry space, such as shear, rotation, and translation, were also introduced, the details of which were the same as listed in Table 1. The only difference between the augmentation strategies was that crop was not applied in the classification network training.
Evaluation metrics
To evaluate the performance of a detection or classification network model, precision (P) and recall (R) are often used. Precision measures the fraction of true objects in identified positive samples, while recall measures the fraction of true samples, with the formulations as
To comprehensively evaluate a model based on both precision and recall, Accuracy (ACC) and F1-score are adopted in this work as well as
where TP, FP, and FN are the true positive, false positive, and false negative, respectively.
Methodologies
Network framework
The presented yield and maturity estimation algorithm mainly included two networks, a one-stage detection network “Deep-count” and a classification network, as shown in Figure 2. The detection network followed the network architecture of YOLO-V4 (Bochkovskiy et al., 2020), which was used to detect and count the fruits on a tree from both the front view and back view. Then, a classification network was applied to classify the detected fruits into mature or immature ones. Although YOLO-V4 can provide the classification of detected objects, our experimental results showed that a classification network could further improve the classification accuracy.
Figure 2. The structure of the proposed yield and maturity estimation method.
Detection network
As shown in Figure 3, the proposed Deep-count included three subnetworks, a backbone network, a Feature Pyramid Network (FPN) (Liu et al., 2018), and a detection output branch. The backbone network often includes a series of convolution and max-pooling layers to process images and preserve spatial feature distribution on feature maps. According to the feature visualization of the feature maps, shallow layers include more detailed features while deep layers contain more semantic features. In this work, we used several ResNet networks (He et al., 2016), including ResNet-34, ResNet-50, and ResNet-101, as the backbone of Deep-count, and a lightweight network MobileNet-V2 was also implemented for comparison. To extract multi-scale features from the backbone, we used feature maps from Level C3 with the size eight times shrunk, Level C4 with the size 16 times shrunk, and Level C5 with the size 32 times shrunk to perform detection.
Since objects were presented in different sizes in view, the FPN was applied to extract, process, and fuse image features from multi-scale feature maps. YOLO-V4 model applies Path Aggregation Network (PANet) as the FPN to process feature maps from Level C3, C4, and C5 of the backbone. Compared to YOLO-V3 that only applies a single-direction feature fusion path from deep levels to shallow levels, the PANet in YOLO-V4 applies bi-direction feature fusion, which fuses features not only from deep levels to shallow levels (C5→C4→C3) but also from shallow levels to deep levels (C5→C4→C3). As a result, feature maps in deep levels of PANet receive detailed features from shallow levels through the path C3→C5, which can improve the localization accuracy of the detection. Meanwhile, feature maps in shallow levels receive semantic features from deep levels following C5→C3, beneficial for increasing the precision of the detection.
In this work, an optimized PANet was adopted for our proposed network architecture (see Figure 3b). Instead of using the general convolutional operation module, our model applied the depth-wise convolution operations, which improves the computational efficiency without sacrificing detection performance in terms of recall and accuracy. Moreover, the FPN was also implemented for comparison (see Figure 3a), and a series of ablation experiments were conducted. The experimental results were summarized in Table 2. It could be seen that the detection networks using the PANet outperformed that using the FPN regarding the precision and F1. Meanwhile, the detection network with our modified PANet achieved better computational speed compared to that with the FPN and original PANet model. Since ResNet-101 achieved the best detection performance, the PANet and ResNet-101 were therefore adopted for the optimized detection network.
Figure 3. The architecture of the detection network, deep-count.
Table 2. Comparison of detection performance on different network architectures.
| Model | Backbone | Precision | Recall | F1 | Time |
|---|---|---|---|---|---|
| YOLO-V4 | DarkNet (53 layers) | 0.92 | 0.93 | 0.92 | 78 ms |
| Deep-count (PANet) | ResNet-34 | 0.84 | 0.88 | 0.85 | 35 ms |
| Deep-count (PANet) | MobileNet-V2 (1.4) | 0.87 | 0.84 | 0.86 | 32 ms |
| Deep-count (PANet) | ResNet-50 | 0.92 | 0.91 | 0.91 | 44 ms |
| Deep-count (FPN) | ResNet-101 | 0.88 | 0.92 | 0.89 | 67 ms |
| Deep-count (PANet) | ResNet-101 | 0.92 | 0.95 | 0.94 | 53 ms |
Lastly, a dense prediction branch was used to process output feature maps from the PANet and encode objects’ confidence, bounding box location, and class information into the feature tensor. Overall, three output tensors from Level C3, C4, and C5 were output and decoded into the detected objects’ list. Nonmaximum suppressing was then used to filter out the objects with confidence beyond the threshold, which was set as 0.5 in this work.
Classification Network
The detected objects might include apples and mis-detected objects. Therefore, a classification network was further applied to filter out the mis-detected results and perform maturity classification. To obtain the optimal classification network model for our method, we comprehensively studied and compared ResNet, DenseNet (Zhu and Newsam, 2018), MobileNet (Sandler et al., 2018), and EfficientNet (Tan and Le, 2019) to obtain the network model with the highest classification accuracy. We trained each model with the same training and augmentation methods using the same image data, and the training parameters were optimized for different networks.
Network implementation and training
The detection network was programmed using TensorFlow 1.15 and the classification network was implemented using Pytorch. The backbone of the detection network used pretrained weights on ImageNet classification, while the PANet and output branch were trained with Adam-Optimizer with a learning rate of 0.001 and a decay rate of 0.9 per epoch. We set the batch size as 32 and trained the network for 80 epochs. Early stopping of training was applied when over-fitting on training data was observed during the training process. The classification network was also trained with Adam-Optimizer with the same setup as that of the detection network. A total of 40 epochs were trained and the batch size was 64. All the network models were trained and evaluated on Ubuntu 18.04 with Nvidia GTX-1080Ti.
Yield estimation
A straight-forward yield estimation algorithm was implemented to approximate the total yield of a tree. Although apples from both sides of the tree could be counted using the deep learning–based method, there were still some mis-detected ones since they were hidden by the leaves. Here, we first counted fruits of a tree from both sides that could be visually captured, and a correction factor was then adopted to include the hidden apples, with the equation formulated as
where Nfront and Nback were, respectively, fruit counts of a tree from the front view and back view, and r is the correction factor. The correlation factor was calculated as a ratio of the sum of manually counted fruits per tree in the real environment to that from images of both sides, and we calculated the correlation ratio by randomly sampled 15 trees from each orchard. To estimate the yield of the whole orchard, we first used the detection network and classification network to count the accurate number of visible apples from both sides of a tree, and this number was then multiplied by the correlation factor to obtain the total yield of the tree. We iteratively performed this operation for a certain number of trees, based on which the total fruit load of an orchard could be then predicted.
Results and Discussion
Experiments on the detection network
We compared our developed detection network, Deep-count, which was a customized YOLO-V4 model, with YOLO-V3, the original YOLO-V4, and Faster-RCNN (Ren et al., 2017). These network models were trained using the same training data as that of Deep-count, while the training parameters were optimized for each model. As shown in Table 3, our Deep-count model achieved the best detection performance among these four models, of which the F1, recall, and precision were 0.92, 0.94, and 0.91, respectively. YOLO-V4 achieved the best performance in the rest of the three models, of which the F1 was 0.907. YOLO-V3 and Faster RCNN achieved similar performance, of which the F1 was 0.887 and 0.892, respectively.
Table 3. Comparison of the detection performance of different network models.
| Model | Precision | Recall | F1 | Time (ms) |
|---|---|---|---|---|
| SSD | 0.82 | 0.84 | 0.83 | 57 |
| Faster-RCNN | 0.87 | 0.86 | 0.87 | 154 |
| YOLO-V3 | 0.87 | 0.90 | 0.88 | 64 |
| Deep-count (FPN) | 0.88 | 0.92 | 0.89 | 67 |
| YOLO-V4 | 0.92 | 0.93 | 0.92 | 78 |
| Deep-count (PANet) | 0.92 | 0.95 | 0.94 | 53 |
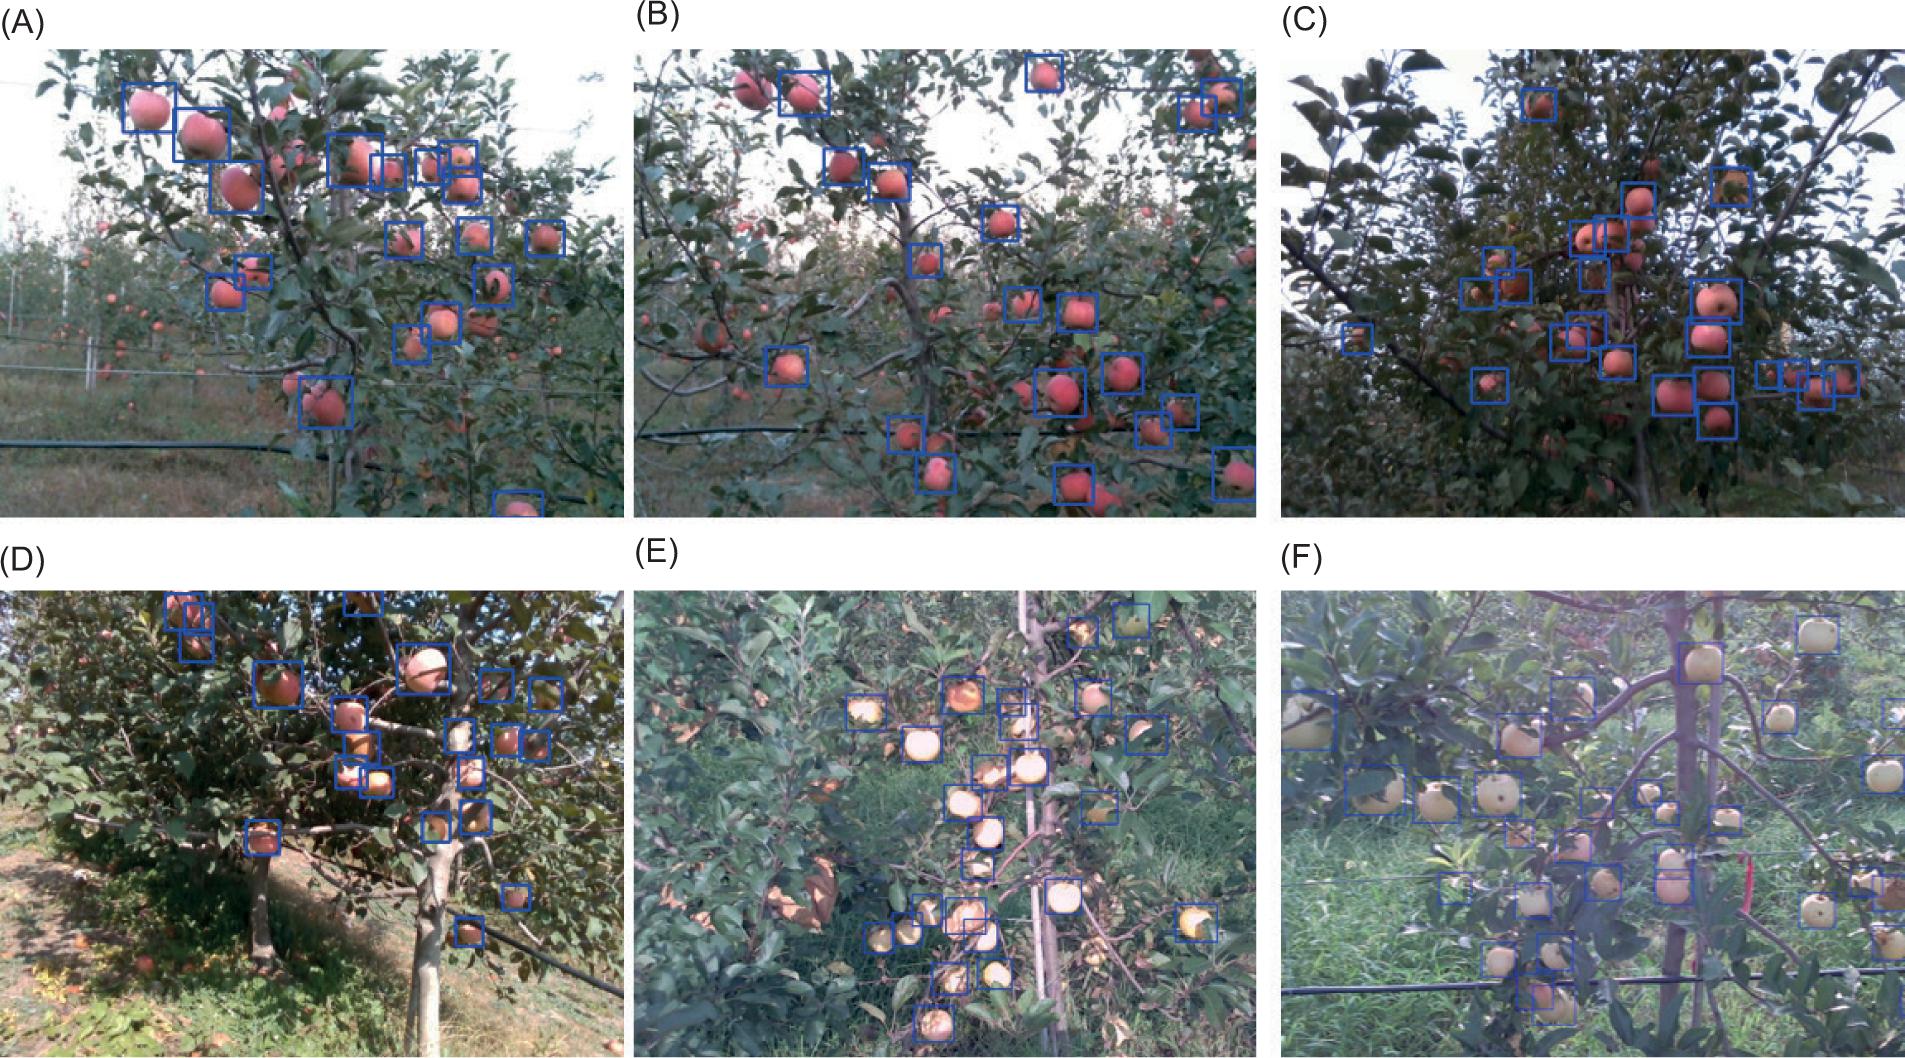
Examples of using Deep-count on images are shown in Figure 4. Due to the illumination and camera view-angle issues, the network might miss a small number of objects that were small in size or covered by collisions. However, the experimental results showed that our optimized network model could accurately and robustly detect most of the visible apples of a tree in orchard environments.
Figure 4. Examples of using Deep-count on images, with the detected apples bounded by blue boxes.
Experiments on the classification network
Since the detection network Deep-count had a high recall and relatively lower precision, the detected objects could be processed by the classification network to filter out the mis-detected objects, which would further improve the accuracy of the detection. Moreover, maturity estimation was also conducted at the same time, which helped decide the time for harvest. We applied ResNet, DenseNet, MobileNet-V2, and EfficientNet in this step and comprehensively compared the performance of these models on this given task. As shown in Table 4, EfficientNet outperformed among these four models. EfficientNet could accurately classify the detected objects into three classes, including mis-detected objects, mature apples, and immature apples, and a high F1 of 0.92 was obtained. The classification errors were mainly induced when distinguishing mature apples from immature apples, and this was caused by the illumination and color variances that significantly complicated the task.
Table 4. Comparison of different classification network models regarding the classification performance.
| Model | Precision | Recall | Mean F1 | ACC |
|---|---|---|---|---|
| VGG-19 | 0.76 | 0.71 | 0.73 | 0.82 |
| MobileNet-V2(1.4) | 0.86 | 0.72 | 0.78 | 0.86 |
| ResNet-50 | 0.86 | 0.82 | 0.84 | 0.89 |
| ResNet-101 | 0.88 | 0.86 | 0.87 | 0.91 |
| DenseNet (k = 24) | 0.89 | 0.91 | 0.90 | 0.93 |
| EfficientNet-b4 | 0.91 | 0.92 | 0.92 | 0.96 |
Experimental on Yield Estimation
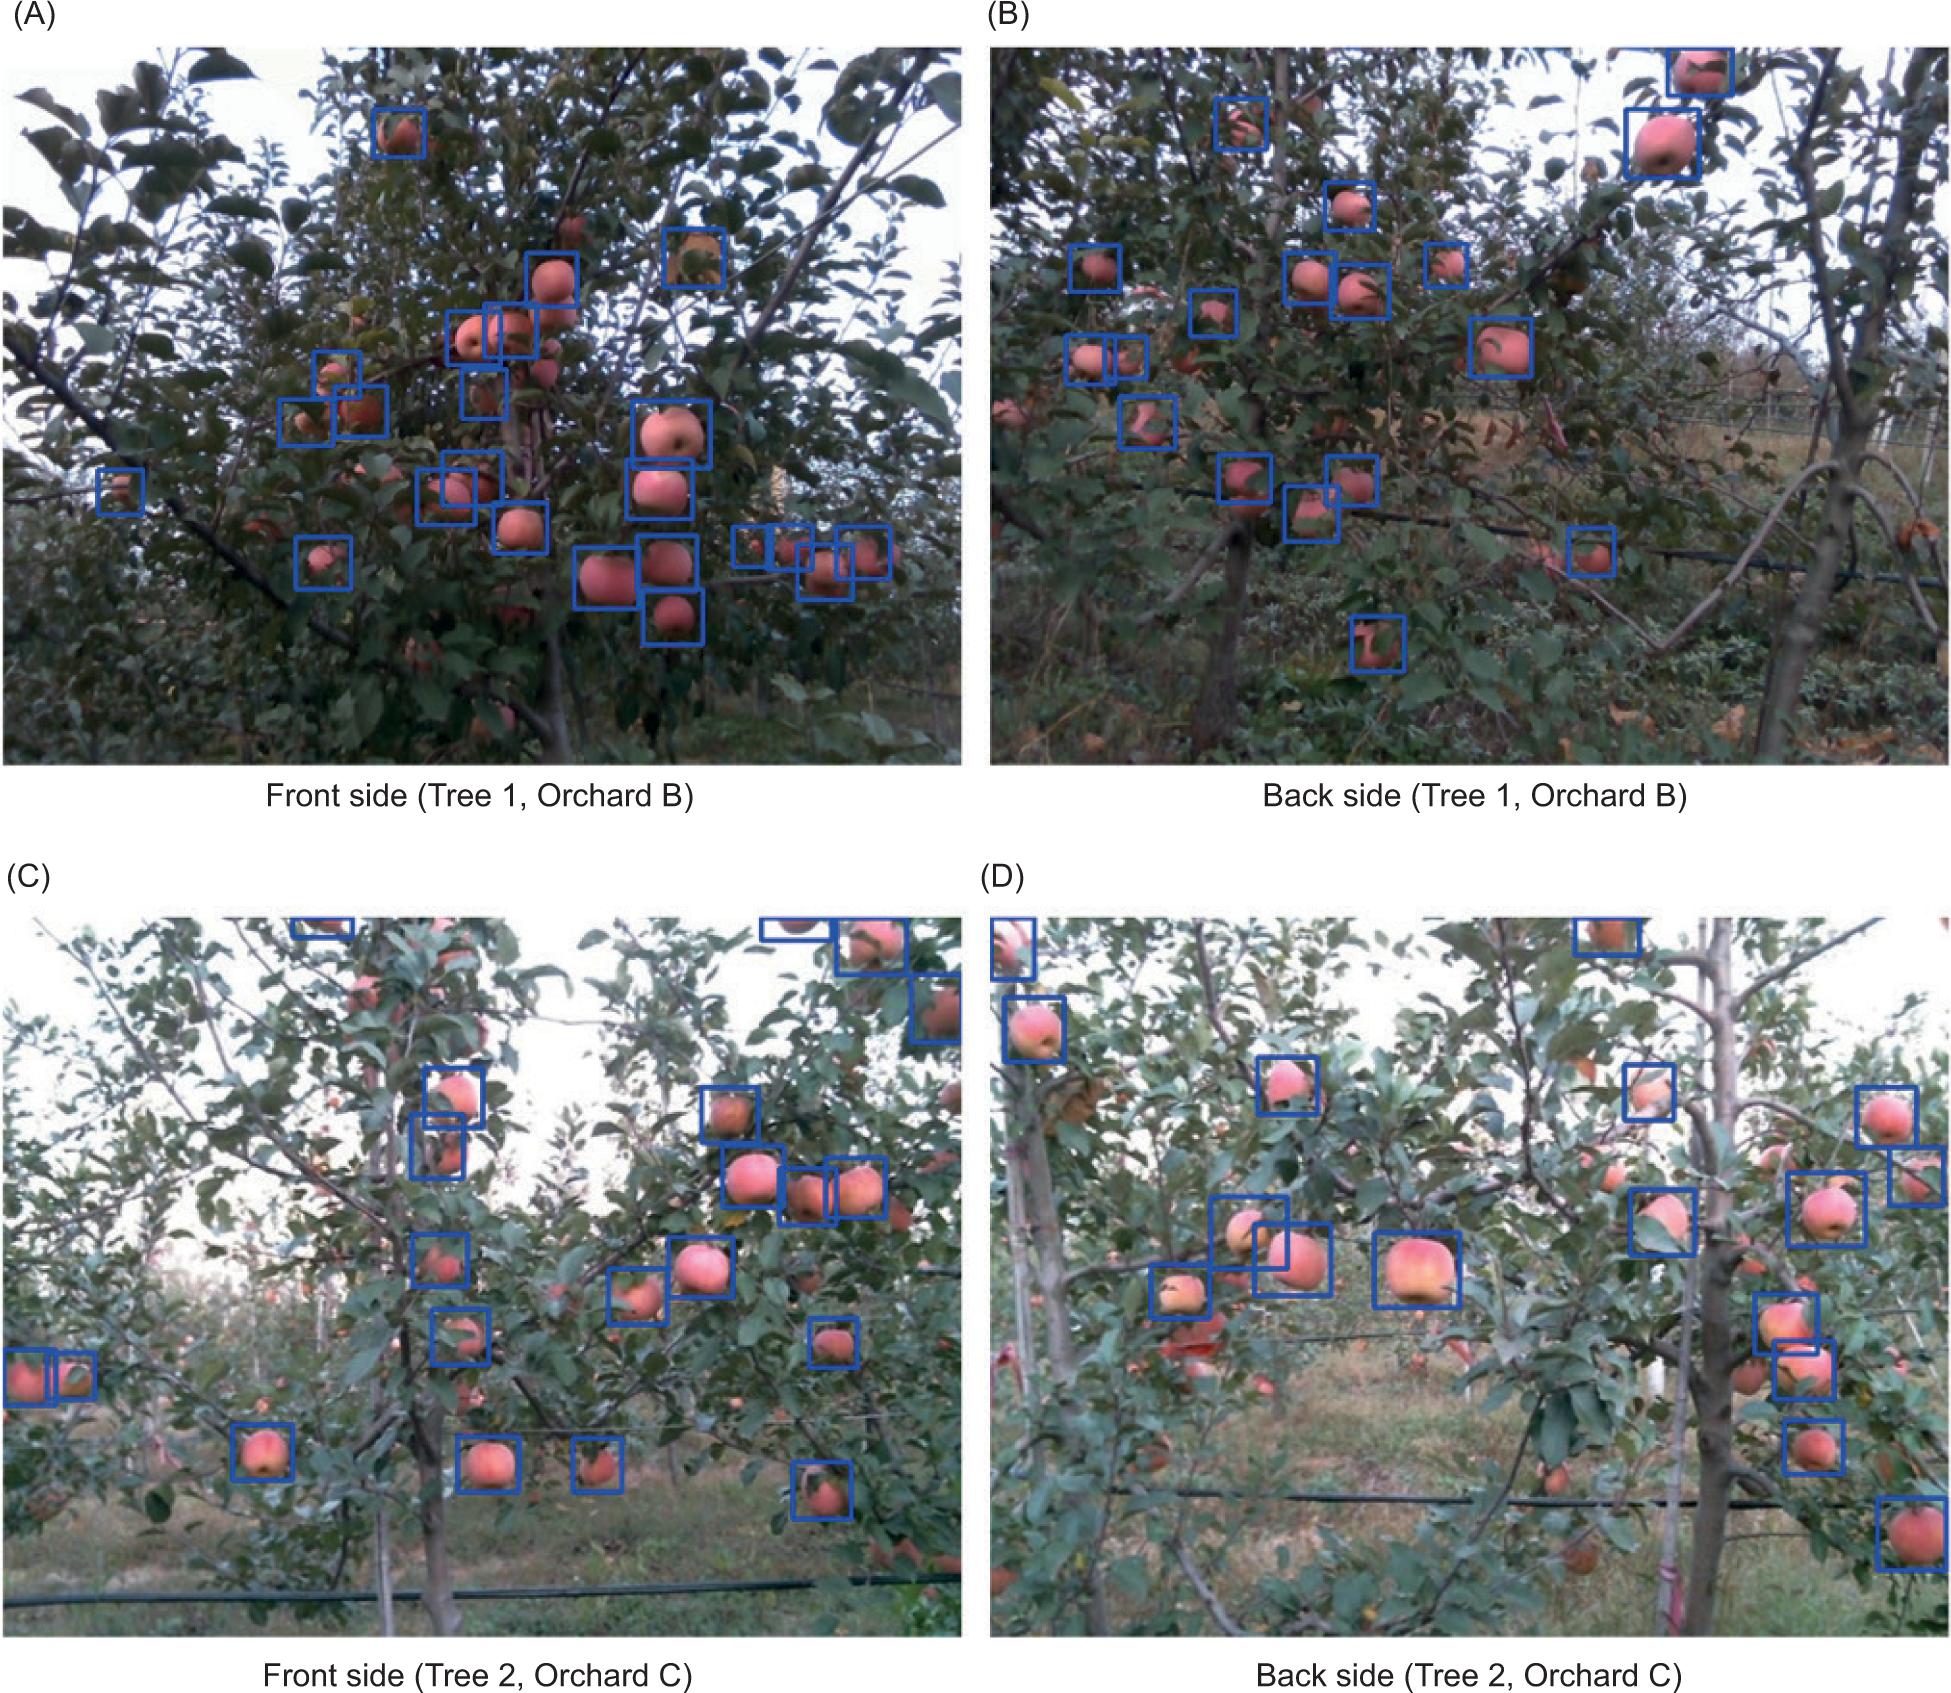
To estimate the fruit load of a tree, a correlation factor was estimated for each orchard. We applied the detection network to count the fruit number fruits of a tree from both sides, as shown in Figure 5. The fruit count of a tree could then be obtained by multiplying the fruit number with the correlation factor. We first calculated the correlation factor of each orchard by comparing the number of fruits obtained using the proposed method and manual counting of five to eight trees. As the results shown in Table 5, the correlation factors for three orchards were 1.09 ± 0.08, 1.04 ± 0.127, and 0.954 ± 0.06, respectively.
Figure 5. Examples of detected apples from both sides of a tree.
Figure 6. Yield estimation error rate in three different orchards.
Table 5. Correlation factors obtained for each orchard.
| Orchard | Image count (mean) | Manual count (mean) | Coefficient |
|---|---|---|---|
| A | 23.7 | 25.6 | 1.090 ± 0.080 |
| B | 37.2 | 33.8 | 1.040 ± 0.127 |
| C | 28.4 | 26.4 | 0.954 ± 0.060 |
The yield of a tree could then be obtained using the proposed method, and we compared its performance with that of several SOTA detection networks including YOLO-V3, YOLO-V4, and Faster-RCNN. The correlation factor used for each orchard was the same for all four network models. As shown in Table 6, the accuracy of yield estimation of YOLO-V4 outperformed that of YOLO-V3 and Faster-RCNN, indicating that the choice of the detection network significantly influenced the counting precision. Moreover, our proposed method obtained even better accuracy than that of YOLO-V4, with the counting errors of only 4.3 ± 1.08%, 4.93 ± 0.83%, and 4.25 ± 1.47% for Orchard A, B, and C, respectively. This was because we optimized the original YOLO-V4 network for better detection performance, and a classification network was then implemented to filter out mis-detected objects to further improve the accuracy for yield estimation.
Table 6. Comparison of the performance of yield estimation using different network models.
| Orchard | Image count (mean) | Manual count (mean) | Error rate (%) |
|---|---|---|---|
| A (Proposed method) | 24.5 | 25.6 | 4.3 ± 1.08 |
| A (Faster-RCNN) | 24.2 | 25.6 | 5.46 ± 1.77 |
| A (YOLO-V3) | 23.6 | 25.6 | 7.8 ± 2.24 |
| A (YOLO-V4) | 27.1 | 25.6 | 5.86 ± 1.12 |
| B (Proposed method) | 36.2 | 34.5 | 4.93 ± 0.83 |
| B (Faster-RCNN) | 32.4 | 34.5 | 6.08 ± 1.89 |
| B (YOLO-V3) | 32.1 | 34.5 | 7.26 ± 2.54 |
| B (YOLO-V4) | 36.6 | 34.5 | 5.21 ± 1.07 |
| C (Proposed method) | 29.4 | 28.2 | 4.25 ± 1.47 |
| C (Faster-RCNN) | 30.6 | 28.2 | 8.5 ± 1.95 |
| C (YOLO-V3) | 25.9 | 28.2 | 8.15 ± 2.56 |
| C (YOLO-V4) | 26.0 | 28.2 | 7.3 ± 1.22 |
Conclusions
In this paper, we presented a deep learning–based method to realize automated yield and maturity estimation of apples in orchards. The proposed method included a detection network to count the visible apples from both sides of a tree, a classification network to filter out mis-detected objects and classify apples according to their maturity, and a fruit load estimation algorithm to obtain the total fruit count of a tree. As for our proposed method, the detection network was the key to the accurate estimation of the yield. To improve the accuracy of the detection network, we chose ResNet-10 as the network backbone and adopted PANet to process multi-scale features. EfficientNet-64 was used as the classification network via a series of comparative tests. According to the comparison of the counting accuracy using the proposed method and several SOTA detection networks, the proposed method outperformed in these networks, indicating that an optimized architecture of the detection network combined with a fine classification network is necessary for enhanced performance in image-based yield estimation. The proposed method can also be readily extended to other fruit crops for automated yield and maturity estimation featuring high efficiency and accuracy.
Authors’ Contributions
ZX was involved in methodology, software, data curation, writing—original draft preparation, and funding acquisition; GS, SZ, and QL were concerned with conceptualization, writing—review and editing, and supervision. All authors have read and agreed to the published version of the manuscript.
Funding
This research was funded by Science and Technology Planning competitive Project of Quzhou (Project number: 2020K03).
Conflicts of Interest
The authors declare no conflict of interest.
REFERENCES
Apolo-Apolo, O.E., Pérez-Ruiz, M., Martínez-Guanter, J. and Valente, J., 2020. A cloud-based environment for generating yield estimation maps from apple orchards using uav imagery and a deep learning technique. Frontiers in Plant Science 11. 10.3389/fpls.2020.01086
Badrinarayanan, V., Kendall, A. and Cipolla, R., 2017. Segnet: a deep convolutional encoder-decoder architecture for image segmentation. IEEE Transactions on Pattern Analysis & Machine Intelligence 39: 2481–2495. 10.1109/TPAMI.2016.2644615
Bandi, S.R., Varadharajan, A. and Chinnasamy, A., 2013. Performance evaluation of various statistical classifiers in detecting the diseased citrus leaves. International Journal of Engineering Science & Technology 5: 298–307.
Bargoti, S. and Underwood, J., 2017. Deep fruit detection in orchards. Proceedings of the IEEE 3626–3633. 10.1109/ICRA.2017.7989417
Bochkovskiy, A., Wang, C.Y. and Liao, H., 2020. Yolov4: optimal speed and accuracy of object detection. 2004: 10934.
Chen, S.W., Shivakumar, S.S., D Cunha, S., Das, J., Okon, E., Chao, Q., Taylor, C.J. and Kumar, V., 2017. Counting apples and oranges with deep learning: a data-driven approach. IEEE Robotics & Automation Letters 2: 781–788. 10.1109/LRA.2017.2651944
Chen, Y., An, X., Gao, S., Li, S. and Kang, H., 2021. A deep learning-based vision system combining detection and tracking for fast on-line citrus sorting. Frontiers in Plant Science 12. 10.3389/fpls.2021.622062
Chen, Y., Lee, W.S., Gan, H., Peres, N. and He, Y., 2019. Strawberry yield prediction based on a deep neural network using high-resolution aerial orthoimages. Remote Sensing 11. 10.3390/rs11131584
Costa, L., Ampatzidis, Y., Rohla, C., Maness, N., Cheary, B. and Zhang, L., 2021. Measuring pecan nut growth utilizing machine vision and deep learning for the better understanding of the fruit growth curve. Computers and Electronics in Agriculture 181: 105964. 10.1016/j.compag.2020.105964
Das, J., Cross, G., Chao, Q., Makineni, A. and Kumar, V., 2015. Devices, systems, and methods for automated monitoring enabling precision agriculture. In: Proceedings of the IEEE International Conference on Automation Science & Engineering, October 2015, pp. 462–469. 10.1109/CoASE.2015.7294123
Faisal, M., Albogamy, F., Elgibreen, H., Algabri, M. and Alqershi, F.A., 2020. Deep learning and computer vision for estimating date fruits type, maturity level, and weight. IEEE Access 8: 206770–206782. 10.1109/ACCESS.2020.3037948
Fu, L., 2020. Real-time kiwifruit detection in orchard using deep learning on android smartphones for yield estimation. Computers and Electronics in Agriculture 179: 105856. 10.1016/j.compag.2020.105856
Garillos-Manliguez, C.A. and Chiang, J.Y., 2021. Multimodal deep learning and visible-light and hyperspectral imaging for fruit maturity estimation. Sensors (Basel, Switzerland) 21: 1288. 10.3390/s21041288
He, K., Zhang, X., Ren, S. and Sun, J., 2016. Deep residual learning for image recognition. IEEE 770–778. 10.1109/CVPR.2016.90
Hni, N., Roy, P. and Isler, V., 2020. A comparative study of fruit detection and counting methods for yield mapping in apple orchards. Journal of Field Robotics 37: 263–282. 10.1002/rob.21902
Kang, H. and Chen, C., 2019. Fruit detection and segmentation for apple harvesting using visual sensor in orchards. Sensors (Basel, Switzerland) 19. 10.3390/s19204599
Kang, H. and Chen, C., 2020. Fast implementation of real-time fruit detection in apple orchards using deep learning–ScienceDirect. Computers and Electronics in Agriculture 168. 10.1016/j.compag.2019.105108
Liu, S., Qi, L., Qin, H., Shi, J. and Jia, J., 2018a. Path aggregation network for instance segmentation. In: Proceedings of the 2018 IEEE/CVF Conference on Computer Vision and Pattern Recognition (CVPR), pp. 8759–8768. 10.1109/CVPR.2018.00913
Liu, Z., Yong, H., Cen, H. and Lu, R., 2018b. Deep feature representation with stacked sparse auto-encoder and convolutional neural network for hyperspectral imaging-based detection of cucumber defects. Transactions of the Asabe 61: 425–436. 10.13031/trans.12214
Long, H. and Schupp, J., 2018. Sensing and automation in pruning of apple trees: a review. Agronomy 8: 211. 10.3390/agronomy8100211
Mesa, A.R. and Chiang, J.Y., 2021. Multi-input deep learning model with rgb and hyperspectral imaging for banana grading. Agriculture 11. 10.3390/agriculture11080687
Nasiri, A., Taheri-Garavan, D.A. and Zhang, Y.D., 2019. Image-based deep learning automated sorting of date fruit. Postharvest Biology and Technology 153: 133–141. 10.1016/j.postharvbio.2019.04.003
Otsu, N., 2007. A threshold selection method from gray-level histograms. IEEE Transactions on Systems Man & Cybernetics 9: 62–66. 10.1109/TSMC.1979.4310076
Pan, S.Q., Qiao, J.F., Wang, R, Yu, H.L., Wang, C., Taylor, K., Pan, H. 2021. Intelligent diagnosis of northern corn leaf blight with deep learning model. Journal of Integrative Agriculture 2022: 21(4): 1094–1. 10.1016/S2095-3119(21)63707
Ren, S., He, K., Girshick, R. and Sun, J., 2017. Faster r-cnn: towards real-time object detection with region proposal networks. IEEE Transactions on Pattern Analysis & Machine Intelligence 39: 1137–1149. 10.1109/TPAMI.2016.2577031
Roy, P., Kislay, A., Plonski, P.A., Luby, J. and Isler, V., 2019. Vision-based preharvest yield mapping for apple orchards. Computers and Electronics in Agriculture 164: 104879. 10.1016/j.compag.2019.104897
Sandler, M., Howard, A., Zhu, M., Zhmoginov, A. and Chen, L.C., 2018. Mobilenetv2: inverted residuals and linear bottlenecks. In: Proceedings of the 2018 IEEE/CVF Conference on Computer Vision and Pattern Recognition (CVPR), pp. 4510–4520. 10.1109/CVPR.2018.00474
Tan, M. and Le, Q.V., 2019. Efficientnet: rethinking model scaling for convolutional neural networks. 2019: 10691–10700.
Tu, S., Pang, J., Liu, H., Zhuang, N. and Xue, Y., 2020. Passion fruit detection and counting based on multiple scale faster r-cnn using rgb-d images. Precision Agriculture 21: 1072–1091. 10.1007/s11119-020-09709-3
Wan, S. and Goudos, S., 2019. Faster r-cnn for multi-class fruit detection using a robotic vision system. Computer Networks 168: 107036. 10.1016/j.comnet.2019.107036
Wang, Q.I., Nuske, S., Bergerman, M. and Singh, S., 2013. Automated crop yield estimation for apple orchards. In: Proceedings of the Proceedings of International Symposium of Experimental Robotics, pp. 745–758. 10.1007/978-3-319-00065-7_50
Zemmour, E., Kurtser, P. and Edan, Y., 2019. Automatic parameter tuning for adaptive thresholding in fruit detection. Sensors (Basel, Switzerland) 19: 2130. 10.3390/s19092130
Zhao, Z.Q., Zheng, P., Xu, S.T. and Wu, X., 2019. Object detection with deep learning: a review. arXiv e-prints 30: 3212–3232. 10.1109/TNNLS.2018.2876865
Zhu, Y. and Newsam, S., 2018. Densenet for dense flow. In: Proceedings of the 2017 IEEE International Conference on Image Processing (ICIP), September 2017, pp. 790–794. 10.1109/ICIP.2017.8296389