
Download
d AB = a 1 − b 1 2 + a 2 − b 2 2 1 S AB = 1 , 0 − d AB d max 2 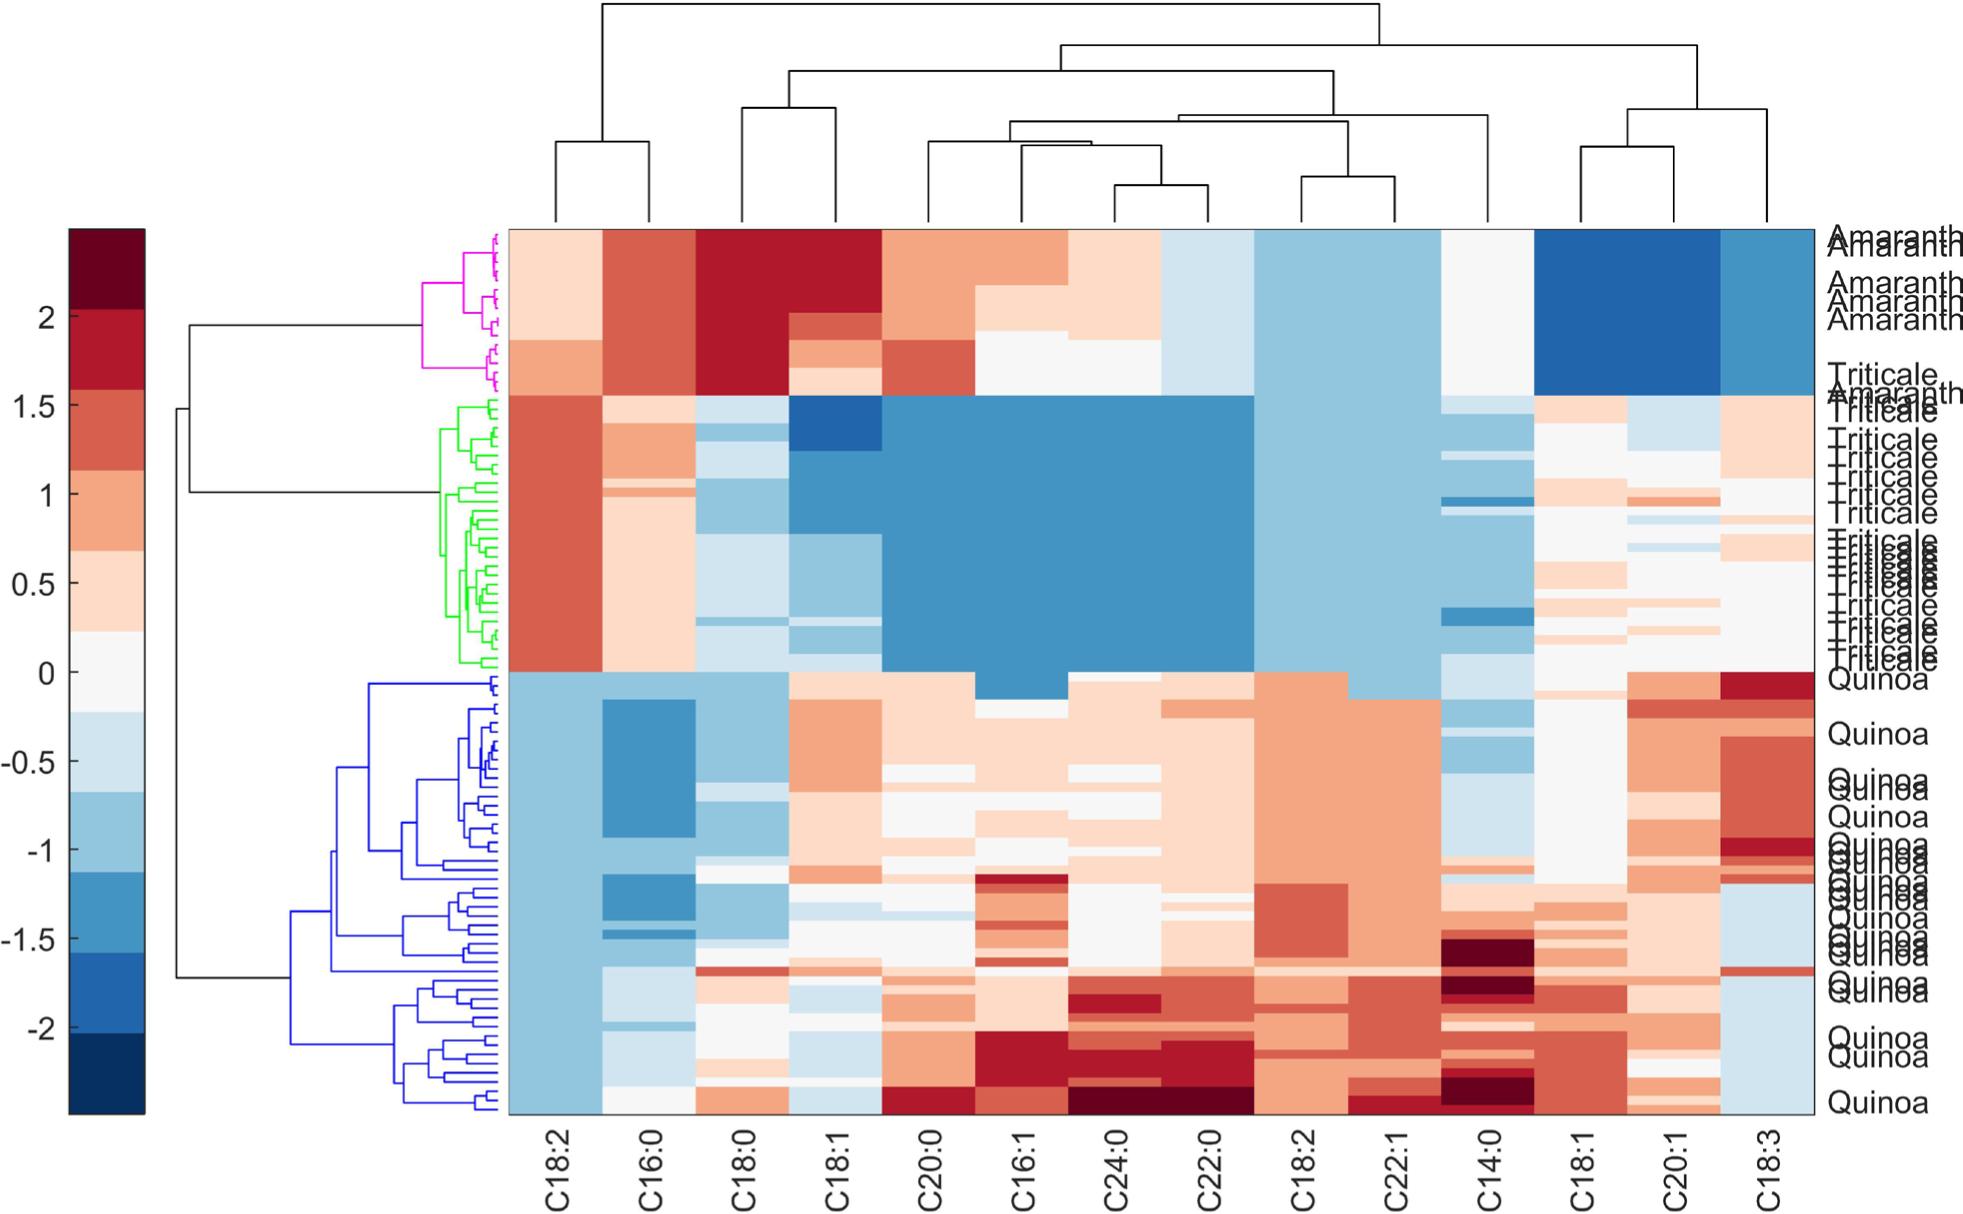
RESEARCH ARTICLE
Discrimination of South American grains based on fatty acid
Daniela Souza Ferreira1*, Júlio Cesar Barbosa Rocha2, Daniel Barrera Arellano3, Juliana Azevedo Lima Pallone3
1Food Engineering Course, Federal University of Maranhão, Social Sciences, Health, and Technology Center, Imperatriz MA, Brazil;
2Department of Food Engineering, Federal University of Ceará, Fortaleza CE, Brazil;
3Department of Food Science, Faculty of Food Engineering, University of Campinas, (UNICAMP), Campinas SP, Brazil
Abstract
This study developed a method for discriminating between Andean indigenous crops and hybrid crops, using total lipid composition, fatty acid profiles, and statistical comparison. Cluster analysis and Principal Component Analysis (PCA) revealed the standard fingerprints of the gas chromatography-FID and the primary fatty acids related to loadings, which shows the explained variance (91.4–99.5%) of the total 32 cultivars, including quinoa (Chenopodium quinoa), amaranth (Amaranthus), and triticale (X Triticosecale), collected from Brazil, Bolivia, Peru, and Argentina. The primary fatty acids found in quinoa, amaranth, and triticale were linoleic (essential PUFA) (36.59–63.04 g 100 g−1), oleic (11.95–36.95 g 100 g−1), and palmitic (essential MUFA) (9.40–20.20 g 100 g−1). All grains presented four groups with the PCA method, with the exception of amaranth, with three groups. Analysed separately, linoleic and eicosenoic acids are related to quinoa; stearic and palmitic acids to amaranth; and linolenic and oleic acids to triticale.
Key words: chemometric, fatty acids, gas chromatography-FID, HCA, heatmap, PCA
*Corresponding Author: Daniela Souza Ferreira, Food Engineering Course, Federal University of Maranhão, CCSST, Imperatriz MA, 65900-410, Brazil. Email: [email protected]
Received: 10 February 2022; Accepted: 29 April 2022; Published: 10 June 2022
© 2022 Codon Publications
This is an Open Access article distributed under the terms of the Creative Commons Attribution-NonCommercial-ShareAlike 4.0 International (CC BY-NC-SA 4.0). License (http://creativecommons.org/licenses/by-nc-sa/4.0/)
Introduction
Some studies have been conducted on new formulations of grain products, such as gluten-free products for those who suffer from gluten-related disorders. Furthermore, disease resistance and environmental tolerance in the field increase production. As examples of beans with these characteristics, we have quinoa (Chenopodium quinoa Willd.) and amaranth (Amaranthus spp.) as pseudocereals gluten-free widely cultivated in the Andean region of South America (Corke et al., 2016; Valencia-Chamorro, 2016). Triticale (X Triticosecale) is an artificial hybrid developed in 1875 by combining genomes of wheat (Triticum spp.) and rye (Secale cereal L.) (Mergoum, 2009). It has been used as a good substitute for wheat in bakery products as well as feed products with high yield and environment adaptability. The grains mentioned above have attracted considerable attention in many scientific studies since 1980, mainly due to their nutritional, functional, agricultural, and technological properties.
Quinoa can adapt to different climatic conditions (rainfall, humidity, and temperature) and soils with different pH values (Valencia-Chamorro, 2016). The biggest producer is Peru, followed by Bolivia and Ecuador, with an increase of almost 20% in production in 3 years (2016 to 2020, 175 thousand tonnes/year), and around 189,000 hectares harvested (FAOSTAT, 2022).
In a USDA Table presented by Navruz-Varli and Sanlier (2016), the nutritional value of wheat, maize, rice, barley, oat, rye, and sorghum, which form the base of the diet pyramid, was compared with quinoa, which was richest in protein (14 g 100 g−1), lipid (6 g 100 g−1), and mineral content (2,5 g 100 g−1 of ash) in relation to those grains. It has been recognized that its adequate balance in essential amino acids, especially lysine, is not found in other grains. Moreover, with a high concentration of mono and polyunsaturated acids, its lipid profile decreases the plasma concentration of total and LDL cholesterol and regulates metabolism (Rustan and Drevon, 2005). However, many studies about quinoa focus on antioxidant properties and potential contribution to human health related to carotenoids, like lutein and zeaxanthin, and tocopherol content (Tang et al., 2015; Vilcacundo and Hernández-Ledesma, 2017).
Quinoa is a pseudo-cereal and one of the oldest cereals consumed in America; due to its similarity to rice, it is used in salad soups, as breakfast cereal when extruded, and its flour is used for the production of bakery products, such as cookies and bread. In addition, quinoa grains can be fermented to make beer and an alcoholic drink called chicha, typically used in religious ceremonies in South America (Urquizo et al., 2017).
Amaranth is a pseudo-cereal crop and the high nutritional quality of its protein content (»16.2 g 100 g−1) (Kurek et al., 2018) is rich in methionine, tryptophan, and lysine, which are superior to most cereals. It has drawn the attention of producers and researchers, mainly in the United States, where it gained popularity. Besides, its composition is 5–8 g 100 g−1 of lipids, 60–65 g 100 g−1 of saccharides, and 3–5 g 100 g−1 of crude fiber (Hlinková et al., 2013). In addition, it is gluten-free and has high-quality starch, lipids, vitamins, and minerals, besides its composition in bioactive components (Barba De La Rosa et al., 2009; Nsimba et al. 2008).
This grain was a staple crop in the Mayan, Incan, and Aztec civilizations. It is still cultivated and consumed in Central and South America and throughout Africa, the Philippines, India, Malaysia, China, Nepal, and Indonesia. China and Russia (300 thousand ha/year, approximately) have large-scale production mainly because of their agricultural characteristics, such as high growth rate and yield, resistance to extreme climatic conditions, such as salinity and acidity, and the possibility of producing biomass (Corke et al., 2016; Khandaker et al., 2010; Peter and Gandhi, 2017).
Amaranth grain has a high potential for multiple uses, such as gluten-free bread, breakfast cereals, infant formulations, flour, and grits. Fractions of the plant can be used as animal food (Corke et al., 2016; Alencar et al., 2015). The Amaranth red coloration is due to the abundant presence of betacyanin and can be used as a natural food coloring.
Triticale has high productivity and quality like wheat, resistance to pests and environmental conditions like rye and the protein. Recently, the most significant 10 producers are Poland, Germany, France, Belarus, China, Russian Federation, Australia, Hungary, Lithuania, and Austria, with an increase of almost 25% in 2 years (2018 to 2020, 15 million tonnes/year), and around 4 million hectares harvested (FAOSTAT, 2022).
This cereal grain is known as a protein source (11–14 g 100 g−1), and it has a good distribution of amino acids, including a high content of lysine, making it more nutritious than wheat proteins (Zhu, 2018). Also, it has a high content of dietary fibers (13–16 g 100 g−1) with attention to a soluble fraction (1.7–2.7 g 100 g−1), lowering lipid levels and glucose in the blood (Rakha and Ansersson, 2011), and phenolic compounds, such as phytoestrogens and alkylresorcinols, besides minerals and vitamins (Jonnala et al., 2010).
Triticale is mainly used for poultry, hogs, and dairy animals. However, nowadays, triticale has been used in the baking industry despite its low gluten content; its flour produces bread of appreciable quality as wheat flour (Frás et al., 2016). Triticale can also be used to manufacture sweets, biscuits, cakes, and tortillas made with sweet maize and good flavor (Singh and Jauhar, 2006). Due to the high level of alpha-amylase, it can be applied in brewing. It is suitable for producing bioethanol, rather than wheat and rye, with economic value and richness of composition of its biomass (Athukorala and Mazza, 2010). It is also used to produce edible films to extend the shelf-life of food as an ingredient of yogurt for functional and antioxidant properties (Zhu, 2018).
Quinoa, amaranth, and triticale are not among the most common grains like maize, rice, and wheat, but we can see them very often in the supermarket and restaurants focused on natural, organic, and vegetarian foods. The geographical origin of these grains is important information for one to know their provenance in terms of traceability, sanitation regulations, or quality control. Furthermore, all these grains have the potential for large-scale commercialization. The fatty acid composition can be used to evaluate the stability, nutritional quality, and authentication of fats and oils, which can be performed by gas chromatography combined with a flame ionization detector (FID), a reliable method for this purpose. To the best of our knowledge, this is an unpublished study. Thus, a method for discriminating Andean indigenous crops and hybrid crops was developed using fatty acid profiles and chemometric tools. From PCA and Heatmap, we mapped the origin of these grains according to the fatty acids that differentiated these samples and considered the environmental characteristics of the collection locations.
Materials and Methods
Materials
Eight quinoa varieties harvested in Brazil were obtained from the Brazilian Agricultural Research Corporation (Embrapa). One quinoa sample was collected from the Quipaquipani community (La Paz, Bolivia), and four other samples were obtained in São Paulo local commercial, but from Bolivia. Three quinoa samples were obtained from Peru’s National Agricultural Innovation System Support Project (INIA). Three amaranth varieties harvested in Brazil were obtained from the germplasm bank of the Brazilian Agricultural Research Corporation (Embrapa). One sample was collected from Oruro, Bolivia. Moreover, two other samples were obtained in São Paulo local commerce, but they were imported from Argentina. Finally, two triticale samples were procured from the germplasm bank of the Agronomic Institute of Campinas (IAC) and eight samples were collected from the germplasm bank of the Brazilian Agricultural Research Corporation (Embrapa). All 32 samples are cited in Table 1.
Table 1. Total and range of lipid content of collected quinoa, amaranth, and triticale samples.
| Origin | Range (%) | Code | Total Lipid content (g 100 g−1) Mean ± SD | |
|---|---|---|---|---|
| Quinoa | Brazil | 5.44–8.15 | T2 Médio 1111 | 5.55 ± 0.09 |
| SC2 Médio 1107 | 5.99 ± 0.09 | |||
| SC1 Precoce 1106 | 6.21 ± 0.04 | |||
| Exp-2 1213 | 5.79 ± 0.10 | |||
| 1315 | 6.77 ± 0.04 | |||
| 1366 | 7.89 ± 0.00 | |||
| 1583 | 7.10 ± 0.04 | |||
| Exp-2 1229 | 8.11 ± 0.05 | |||
| Bolivia | 5.21–6.46 | Quipaquipani, La Paz | 5.29 ± 0.08 | |
| Preta orgânica Sta Filomena | 5.44 ± 0.13 | |||
| Mista Vitalin | 6.00 ± 0.24 | |||
| Vitalin | 5.89 ± 0.10 | |||
| Vermelha Orgânica | 6.33 ± 0.11 | |||
| Peru | 5.79–6.45 | Sajama INIA | 5.90 ± 0.06 | |
| Salcedo INIA | 6.39 ± 0.02 | |||
| Passan Kalla | 5.94 ± 0.13 | |||
| Amaranth | Brazil | 5.79–6.45 | A2 | 7.49 ± 0.24 |
| A3 | 7.35± 0.25 | |||
| BRS Alegria | 6.71 ± 0.25 | |||
| Bolivia | 5.65–6.21 | Oruro Bolivia | 5.96 ± 0.29 | |
| Argentina | 6.48–7.37 | Sta Filomena Argentino | 7.21 ± 0.14 | |
| Amaranto flocos | 6.73 ± 0.22 | |||
| Triticale | Brazil | 1.63–2.55 | E 53261/09 SM | 2.39 ± 0.28 |
| E 18847/04 SM | 2.14 ± 0.02 | |||
| BRS 2031000/08 | 1.99 ± 0.03 | |||
| BRS Minotauro 263/09 | 2.41 ± 0.01 | |||
| BRS Ulisses 260/09 SM | 2.33 ± 0.06 | |||
| BR4 | 1.97 ± 0.21 | |||
| Saturno | 2.31 ± 0.12 | |||
| 148 | 2.13 ± 0.10 | |||
| Triticale IAC 2 | 2.41 ± 0.04 | |||
| Triticale IAC 3 | 1.74 ± 0.10 |
Fatty acid composition
According to Bligh and Dyer’s (1959) method 923.03 of AOAC (1995), total lipid content was assessed gravimetrically. The data collection was performed in triplicate. The fatty acids in the oil sample were converted to fatty acid methyl esters (transmethylation) using the method described by Hartman and Lago (1973). The fatty acid methyl esters composition analyses were carried out on a gas chromatograph (GC Agilent 6850 Series GC System) equipped with a flame ionization detector (FID) and a capillary column (DB-23, Agilent), with the dimensions: 60 m length × 0.25 mm internal diameter × 0.25 μm thickness. The operation conditions of the chromatograph were: linear velocity = 24 cm/s; column flow = 1.0 mL/min; injector temperature = 250°C; detector temperature = 280°C; oven temperature = 110–215°C to 5°C/min, 215°C for 24 min; carrier gas—helium; injection split, ratio 1:50; injection volume = 1.0 μL following the methodology of Ribeiro et al. (2012) with adaptations. The peaks for fatty acids were identified by retention times, and the concentration of each compound in the chromatogram was estimated based on its relative area.
Mean indexes
Three indexes characterizing the fatty acid were calculated, according to the definition below (Laroussi-Mezghani et al., 2015):
-
Monounsaturation index (MUI) is the ratio of the sum of monounsaturated fatty acids to the sum of saturated fatty acids.
-
The polyunsaturation index (PUI) is the ratio of polyunsaturated fatty acids to the sum of saturated fatty acids.
-
The total unsaturation index (TUI) is the ratio of monounsaturated fatty acids and polyunsaturated fatty acids on the sum of saturated fatty acids.
Modeling
Multivariate analyses were performed using PLS Toolbox v. 7.3.1 (Eigenvector Research, Wenatchee, WA, USA) for Matlab version R2014a (MathWorks, South Natick, MA, USA). Principal component analysis (PCA) and hierarchical clustering analysis (HCA) are unsupervised multivariate methods that reduce the data dimensionality and allow the identification of standards of samples and groupings (Manley et al., 2008). Initially, the chromatograms were pretreated using standard normal variate (SNV) (Tomasi et al., 2011) or the first derivative (Savitzky–Golay algorithm) (Savitzky and Golay, 1964); all data were autoscaled. The PCA model was built from the preprocessing dataset, and it was applied to all test sets separately: quinoa, amaranth, and triticale. The number of principal components (PCs) was selected based on the captured variance. Some samples were considered outliers and removed after analyzing the graph of Hotelling’s T2 and Q residuals (Naes et al., 2002). Hierarchical cluster analysis (HCA) was employed for exploratory analyses of all grains, and Euclidean distances were made to obtain a dendrogram with clusters and HeatMap (Mohammadi and Prasanna, 2003).
Nomenclature
Fatty acids:
-
C14:0, myristic acid (tetradecanoic acid);
-
C16:0, palmitic acid (hexadecanoic acid);
-
C16:1ω7, palmitoleic acid (9-hexadecenoic acid);
-
C18:1ω9, oleic acid (9-octadecenoic acid);
-
C18:1ω9t, elaidic acid ([E]-octadec-9-enoic acid);
-
C18:2ω6, linoleic acid (9,12-octadecadienoic acid);
-
C18:3ω3, linolenic acid (9,12, 15-octadecatrienoic acid);
-
C20:0, arachidic acid (eicosanoic acid);
-
C20:1ω9, gondoic acid (11-eicosenoic acid);
-
C22:0, behenic acid (docosanoic acid);
-
C24:0, lignoceric acid (tetracosanoic acid).
Results and Discussion
Lipid composition and profile
Starting with the retention time of fatty acids for chromatographic analysis, the concentration of each compound in the chromatogram was estimated based on its relative area (Ribeiro et al., 2012). Table 2 presents the maximum and minimum content of 15 fatty acids detected by GC-FID of quinoa, amaranth, and triticale, totalizing 96 samples with triplicates. Table 1 presents the total lipid content analyzed by Bligh and Dyer (1959), and the range of lipid content for each grain, its origin, mean, and standard deviation for each sample, with its code. The quinoa grain presented the major lipid content (5.21–8.15 g 100 g−1) when compared to amaranth (5.65–7.75 g 100 g−1) and triticale (1.62–2.55 g 100 g−1), and a significant variability of fatty acids as well (Table 1). At least 14 fatty acids could be identified in quinoa samples. Triticale is not considered an oilseed, and it was not detected in C16:1, C20:0, C22:0, C22:1, and C24:0, found in chromatographs of quinoa and amaranth (Table 2). Amaranth oil had higher levels of oleic acid C18:1 (27.97–36.95 g 100 g−1), palmitic acid C16:0 (18.86–20.20 g 100 g−1), and stearic acid C18:0 (3.43–3.69 g 100 g−1) compared to quinoa (max. 29.25 g 100 g−1, max. 14.3 g 100 g−1, max. 2.57 g 100 g−1, respectively) and triticale (max. 18.92 g 100 g−1, max. 18.28 g 100 g−1, max. 1.29 g 100 g−1, respectively) oils (Table 2). Oleic acid presents oxidative stability, so it is associated with a long shelf-life; this is an advantage for developing new products of amaranth (Mouithys-Mickalad et al., 2021).
Table 2. Fatty acids (g 100 g−1) of 32 cultivars of quinoa, amaranth, and triticale grains.
| ω-Characteristics | Fatty acid | Quinoa | Amaranth | Triticale | ||||||
|---|---|---|---|---|---|---|---|---|---|---|
| Mean | Min | Max | Mean | Min | Max | Mean | Min | Max | ||
| Saturated | C14:0 (Myristic) | 0.24 | 0.14 | 0.39 | 0.21 | 0.19 | 0.22 | 0.14 | 0.11 | 0.17 |
| C16:0 (Palmitic) | 11.24 | 9.40 | 14.33 | 19.68 | 18.86 | 20.20 | 16.66 | 15.41 | 18,28 | |
| C18:0 (Stearic) | 1.26 | 0.59 | 2.57 | 3.58 | 3.43 | 3.69 | 0.98 | 0.74 | 1.29 | |
| C20:0 (Arachidic) | 0.61 | 0.35 | 1.07 | 0.83 | 0.78 | 0.91 | ||||
| C22:0 (Behenic) | 0.86 | 1.57 | 0.52 | 0.36 | 0.34 | 0.39 | ||||
| C24:0 (Lignoceric) | 0.42 | 0.23 | 0.83 | 0.31 | 0.22 | 0.37 | ||||
| Total | 14.63 | 12.28 | 58.32 | 24.97 | 23.82 | 25.78 | 17.78 | 16.26 | 19.74 | |
| Monounsaturated | C16:1–7 (Palmitoleic) | 0.17 | 0.11 | 0.29 | 0.15 | 0.10 | 0.19 | |||
| C18:1–9 (Oleic) | 24.68 | 18.79 | 29.25 | 33.09 | 27,97 | 36,95 | 15.31 | 11.96 | 18,92 | |
| C18:1–9t (Elaidic) | 1.11 | 0.79 | 1.54 | 0.97 | 0.88 | 1.10 | ||||
| C20:1–11 (Cis-11-eicosenoic) | 1.49 | 1.23 | 1.72 | 0.27 | 0.23 | 0.31 | 1.14 | 0.83 | 1.64 | |
| C22:1–9 (Docosenoic) | 1.41 | 1.26 | 1.94 | |||||||
| Total | 28.69 | 22.07 | 34.45 | 33.36 | 28.2 | 37.26 | 17.42 | 13.67 | 21.66 | |
| Polyunsaturated | C18:2–6 (Linoleic) | 50.82 | 45.94 | 59.33 | 40.78 | 36.59 | 46.78 | 59.80 | 57.64 | 63.05 |
| C18:2–6t (Trans-linoleic) | 0.18 | 0.13 | 0.25 | |||||||
| C18:3–3 (Linolenic) | 5.49 | 2.94 | 8.87 | 0.75 | 0.69 | 0.79 | 4.99 | 4.42 | 5.71 | |
| Total | 56.49 | 49.01 | 68.45 | 41.53 | 37.28 | 47.57 | 64.79 | 62.06 | 68.76 | |
| MUI | 2.05 | 1.27 | 2.66 | 1.34 | 1.17 | 1.49 | 0.99 | 0.73 | 1.28 | |
| PUI | 3.97 | 2.58 | 5.06 | 1.67 | 1.47 | 1.97 | 3.65 | 3.36 | 3.87 | |
| TUI | 6.03 | 3.87 | 7.45 | 3.01 | 2.92 | 3.14 | 4.64 | 4.15 | 5.08 | |
MUI, Monounsaturation index.
PUI, Polyunsaturation index.
TUI, Total unsaturation index.
The most abundant fatty acids in all grains are C18:2 linoleic acid, C18:1 oleic acid, and C16:0 palmitic acid. The fourth fatty acid to quinoa and triticale was C18:3 linolenic acid (PUFA) and rice bran oil (Li et al., 2018). Despite amaranth being a pseudo-cereal as quinoa, its fourth fatty acid in composition was C18:0 stearic, with C18:3 linolenic and C20:0 arachidic fifth-ranked. This means that the genetic similarity is not the definition of lipid profile and the environmental conditions are more robust to grouping the samples as presented by Halford et al. (2015), showing that specific environmental stress can affect grain composition.
Linoleic acid (LA) (18:2n-6 (cis-9,12-Octadecadienoic acid, C18:2n6c)), the number one in these grains, belongs to the PUFA families (polyunsaturated fatty acids) as a-linolenic acid (cis-9,12,15-octadecatrienoic, C18:3n3) and are essential fatty acids; in other words, the human body is not capable of synthesizing them, being dependent on good nutrition. High content of PUFA are traditionally found in dairy products, meat and deficient vegetable oils, which is advantageous to these grains. In addition, much research suggests that linoleic acid can protect against some types of cancer, increase metabolic rate, enhance the functioning of the immune system, reduce food-induced allergic reactions, and reduce insulin resistance (Hamilton and Klett, 2021).
Quinoa has significantly higher amounts of linolenic acid (C18:3) (»5,5 g 100 g−1) than amaranth (»0,74 g 100 g−1). This report is similar to previous comparisons in literature (Luo et al., 2021). A-linolenic acid (18:3n-3, ALA), a long chain ω-3 polyunsaturated fatty acid (PUFAs), is the most abundant ω-3 in the diets (Jahaniaval et al., 2000; Luo et al., 2021). Its role in metabolism is that of a precursor to eicosapentaenoic acid (EPA; 20:5ω-3) and docosahexaenoic acid (DHA; 22:6ω-3), which are known promotors of health benefits, such as reduction of cardiovascular disease, enhanced sight and neurological development, and improvements in inflammatory conditions (Dias et al., 2022).
Table 2 presents the indexes monounsaturation index (MUI), polyunsaturation index (PUI), and total unsaturation index (TUI), showing that the amount of unsaturated fatty acids is higher than saturated fatty acids of all grains (Indexes >1), conferring healthiness, except for triticale, the MUI index MUI of which was less than 1. The total unsaturation index per saturation, in descending order, for quinoa, triticale, and amaranth were 6.03; 4.64, and 3.01, respectively. Quinoa contains predominantly unsaturated fatty acids, as reported previously by other authors (Pereira et al., 2019; Tang et al., 2015). Amaranth, as mentioned before, despite being a pseudo-cereal like quinoa, presents a saturation distribution different from the others.
Quinoa
The lipid content found in 16 quinoa collected samples from Brazil, Bolivia, and Peru ranged between 5.21 and 8.15 g 100 g−1, while higher fat content was identified in samples from Embrapa Cerrados research center, Brazil (Table 1). Although the content of the total lipid of quinoa grain evaluated in this study is smaller than in previous studies, probably as a result of a different method of analysis, the profile of fatty acids was inside the expected range and similar to other plants such as maize, rice bran, and soybeans (Li et al., 2018).
For Brazilian quinoa samples, the C22:1 erucic acid (EA) was the fifth more abundant and the C20:1 (20:1ω9, gondoic acid (11-eicosenoic acid)) the sixth in content, the Bolivian quinoa presented the contrary, higher amounts of C20:1 instead of C22:1. Erucic acid (EA) is a monounsaturated fatty acid (FA) with a long chain and double bond in the omega 9 positions. Like other fatty acids, it is digested, absorbed, and metabolized but has adverse effects on the heart when in excess (Rabbani et al., 2017). Supposedly excess monounsaturated fatty acids with 22 carbons (22:1) in the diet cause a transient accumulation (lipidosis) of triacylglycerol in the heart and other tissues (Rabbani et al., 2017). These fatty acids are abundant in canola oil, mustard oil, and rapeseed oil and can be used as a food-grade lubricant. Considering health benefits, Bolivia quinoa is the winner because studies pointed out that cis-11-eicosenoic acid (C20:1) and cis-11,14-eicosadienoic acid (C20:2, not found in this study) at concentrations of 0.01 g 100 g−1 significantly inhibited Staphylococcus aureus biofilm formation and anti-hemolytic activity extracted from Moringa oleifera (Lee et al., 2017).
Seven major fatty acids identified in the quinoa sample set were oleic (C18:1, n-9) (18.79–29.25 g 100 g−1), palmitic (C16:0) (9.40–14.33 g 100 g−1), stearic (C18:0) (0.59–2.99 g 100 g−1), docosenoic (C22:1, n-9) (0–1.94 g 100 g−1), eicosenoic (C20:1, n-9) (1.23–1.71 g 100 g−1), with attention to essential PUFAs, linoleic (C18:2, n-6) (41.76–59.33 g 100 g−1), and linolenic (C18:3, n-3) (2.94–8.87 g 100 g−1). Despite quinoa having lower lipid composition in comparison with soybeans (19.0 g 100 g−1), it has higher amounts than wheat (1–2 g 100 g−1), maize (4.7 g 100 g−1), rice (<1 g 100 g−1), and other grains, becoming an alternative oilseed and staple food. Furthermore, gluten-free bread and tarhana produced with quinoa flour resulted in better texture, volume, and nutritional and sensory properties (Çevic and Ertas, 2019; Filho et al., 2017; Turkut et al., 2016).
The content of unsaturated fatty acids was similar to that presented by Luo et al. (2021) (16–68 g 100 g−1). However, the values presented in this study for MUI, PUI, and TUI indexes (2.05, 3.97, and 6.03, respectively) were higher than the values published for quinoa samples from several countries, such as India, the United States, Guatemala (MUI = 1.04, PUI = 1.31, TUI = 2.36), indicating higher unsaturated acid content than saturated acids (Tang et al., 2015).
Amaranth
The lipid content found in six amaranth samples from Brazil, Bolivia, and Argentina ranged between 5.65 and 7.75 g 100 g−1, while higher fat content was identified in samples from Embrapa Cerrados research center, Brazil. The major of fatty acids in amaranth were linoleic (C18:2, n-6) (36.59–46.78 g 100 g−1), oleic (C18:1, n-9) (27.97–36.95 g 100 g−1), palmitic (C16:0) (18.86–20.20 g 100 g−1), stearic (C18:0) (3.42–3.69 g 100 g−1), arachidic (C20:0) (0.77–0.91 g 100 g−1), and linolenic (C18:3, n-3) (0.69–0.79 g 100 g−1) acids. Studies reported similar fatty acid profiles for amaranth from Canada, the United States, and China, with palmitic (12–25 g 100 g−1), oleic (19–35 g 100 g−1), linoleic (25–62 g 100 g−1), stearic (2–8.6 g 100 g−1), and linolenic (0.3–2.2 g 100 g−1) acids (Corke et al., 2016; Jahaniaval et al., 2000). In this study, the sample from Argentina presented the lowest level for oleic acid C18:1 (»28 g 100 g−1) compared with samples from Bolivia (»33 g 100 g−1) and Brazil (»34 g 100 g−1).
Comparing MUI, PUI, and TUI rates (0.96, 1.65, 2.16, respectively) for varieties of amaranth from Canada and the United States (Jahaniaval et al., 2000), in the present study, the values presented were higher (1.34; 1.67 and 3.01), indicating higher content of unsaturated fatty acids than saturated acids.
Triticale
The lipid content found in 10 triticale samples from Brazil ranged between 1.62 and 2.55 g 100 g−1. These results are superior to the previous report for nine genotypes of triticale (1.2 to 1.6 g 100 g−1), besides being superior to wheat (1.3 g 100 g−1) (Frás et al., 2016). Five identified major fatty acids in the triticale samples were listed as linoleic (C18:2, n-6) (57.64–63.04 g 100 g−1), oleic (C18:1, n-9) (11.95–18.92 g 100 g−1), palmitic (C16:0) (15.41–18.27 g 100 g−1), linolenic (C18:3, n-3) (4.41–5.71 g 100 g−1), and eicosenoic (C20:1, n-9) (0.83–1.64 g 100 g−1).
Comparing the MUI, PUI, and TUI rates (0.57, 2.49, 3.07, respectively) of triticale varieties in the United States (Zhu, 2018), the present study presented higher values (0.99, 3.65, and 4.64), indicating higher content of unsaturated fatty acids than saturated acids, improving the nutritional value of products with Brazilian triticale. For example, the development of healthy bread with triticale-oat (Frás et al., 2018).
Exploratory analysis—modeling PCA
In general view
Until now, quantitative analysis of fatty acids present in the grains was performed through GC-FID. A qualitative analysis is made to determine which primary fatty acids impact the possible grouping for each of the samples according to vegetable variety and origin, seasonality, climate, and geographical location, like the olive oils study conducted by Laroussi-Mezghani et al. (2015) and Halford et al. (2015). In order to observe the similarity or difference among the studied grains from the chromatography results, two methods of exploratory analysis of the data were applied, along with a hierarchical cluster analysis (HCA) with HeatMap and PCA. A matrix of dimension X i,j, with i being the number of samples and j the number of fatty acids from chromatography, was formed.
PCA reduced the dimensionality of multivariate data by designing them in a smaller space without losing the relationships between the samples, indicating samples with distinct behavior and similarities. The method is based on the correlation between variables, where data compression led to new variables, now called autovectors, the PCs. Each PC has its information about the variables, and PC1 has the maximum variance from the original data (Bari et al., 2021).
The variables analyzed in this study were those of the relative area to the chromatogram, allowing us to determine which fatty acid is vital for grouping the samples by origin or species (Amiry et al., 2017; Bari et al., 2021).
In order to have a clear view of the lipid profile in quinoa, amaranth, and triticale, a PCA was performed for all fatty acids, applying zero if not detected in samples, totalizing 14 variables and a matrix of 96 × 14. The data were auto-scaled so that their different magnitude would not jeopardize the analysis. It was decided that two PCs represent 79.49% of the variance in the data, as expected, for exploratory analysis (Bari et al., 2021). The results showed that it was possible to distinguish an isolated group consisting of five quinoa seeds (data not shown). Embrapa developed all these varieties (see Table 1), but there is differentiation in lipid profile impacted by genetic differences and development seasons, as observed in old and modern Italian wheat varieties (Tavoletti et al., 2018).
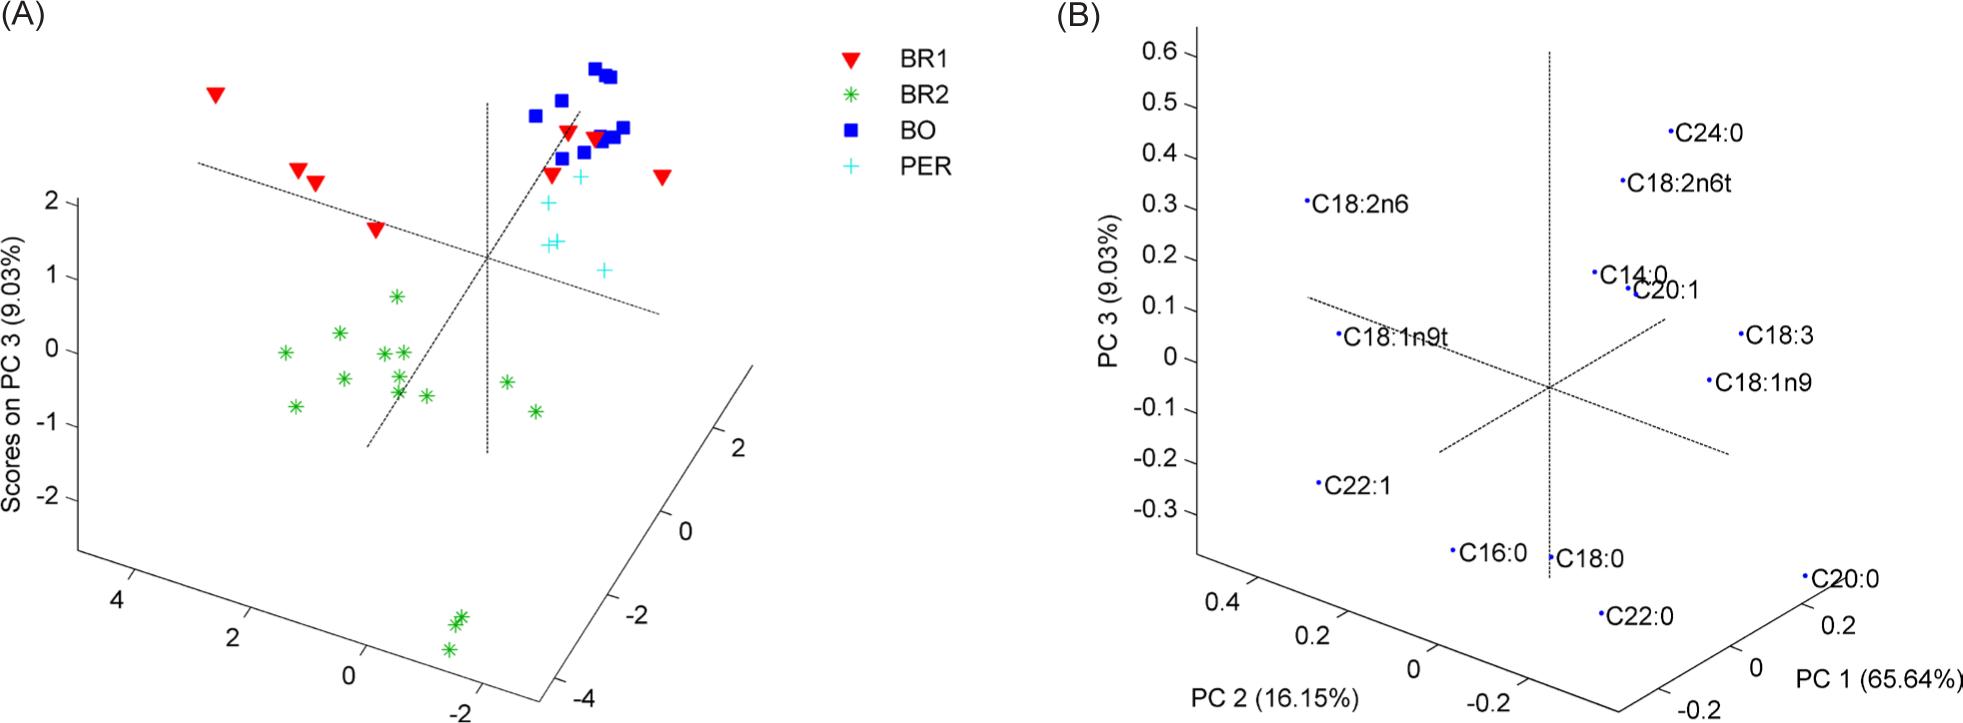
For quinoa samples (Figure 1), three PCs explained 90.82% of the total variance, and four groups were observed using PCA. The quinoa samples from Bolivia (BO) were separated with PC1 and PC2, and two groups were observed for Brazilian samples, BR1 and BR2. The quinoa developed by Embrapa corresponded to different harvest seasons, and some showed similarities in the lipid profile concerning the Bolivian samples, depending on genetic characteristics (Tavoletti et al., 2018). The load analysis revealed that PC1 could be correlated with lignoceric (C24:0) and trans-linoleic (C18:2n6) minor fatty acids, which positively separated Bolivia samples; additionally myristic acid (C14:0), cis-11-eicosenoic acid (C20:1), linolenic acid (C18:3), and oleic acid (C18:1n9), which positively separated samples from Peru. PC2 contributed positively with trans oleic acid (C18:1n9t), docosenoic acid (C22:1), and palmitic acid (C16:0). Moreover, it contributed negatively to stearic acid (C18:0) and docosanoic acid (C22:0), separating Brazilian samples from other samples from Latin America. PC3 represents less than 10% of the data variance and contributes to the separation between BR2 samples from others. PC1, which represents the highest variance of the data, was also responsible for the differentiation of samples through unsaturated fatty acids, which are in greater quantity in quinoa samples (Luo et al., 2021).
Figure 1. Quinoa plot Scores (A) and Loadings (B) on 2PC (90.82% variance).
BR1, BR2: Brazil, Embrapa; BOL: Bolivia; PER: Peru.
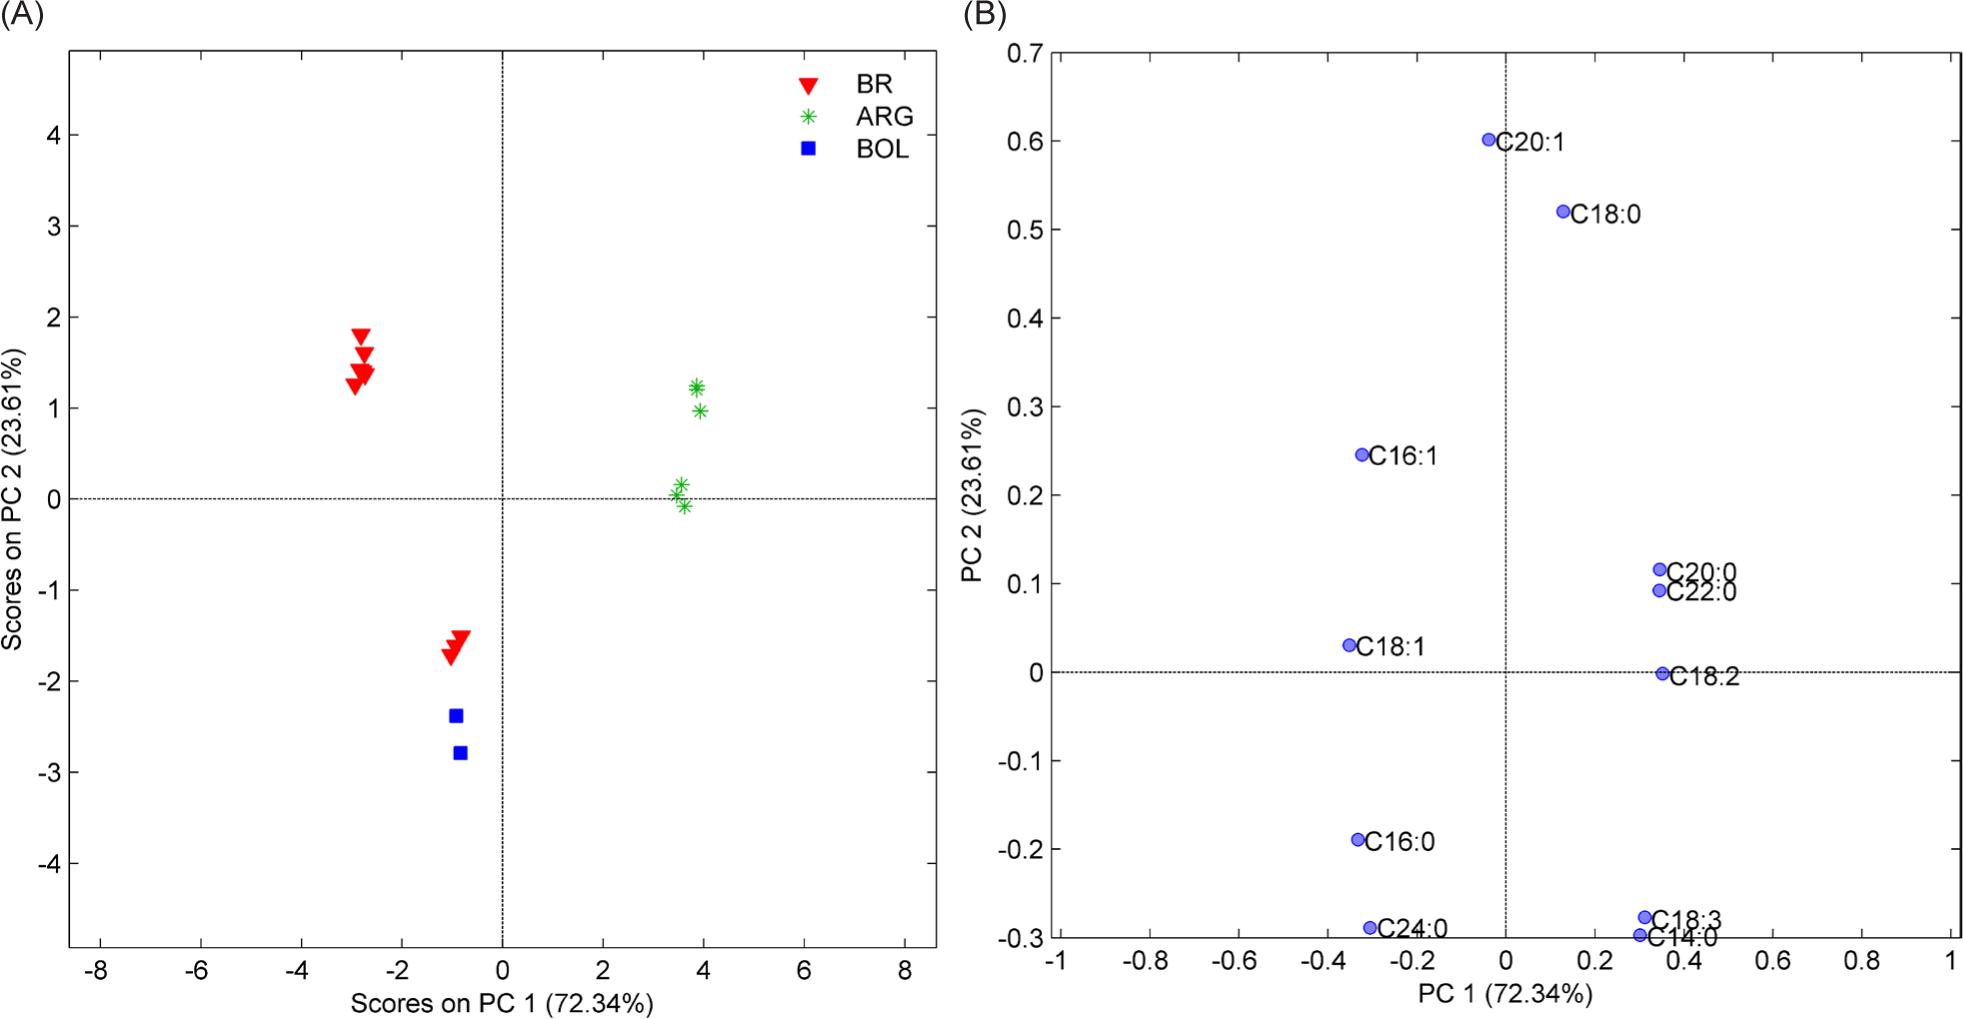
For amaranth (Figure 2), two PCs explained 95.95% of the total variance. Four groups were also observed for amaranth grains, and Brazilian samples were separated probably by the different harvest seasons, some showing similarities in lipid profile with the Bolivian samples. The dominant variables for PC1 were arachidic acid (C20:0), docosanoic acid (C22:0), and linoleic acid (C18:2), which positively separated the Argentinean samples from the other samples, and negatively by oleic acid (C18:1n9), palmitic acid (C16:0), and lignoceric acid (C24:0) separating the Bolivian and some Brazilian samples. TPC2 represented 23.61% of the variance explained, with palmitoleic acid (C16:1) and with the separation of the Brazilian sample groups.
Figure 2. Amaranth plot Scores (A) and Loadings (B) on 2PC (95.95% variance).
BR: Brazil; ARG: Argentina; BOL: Bolivia.
Three Brazilian samples, two Argentinian, and only one sample from Bolivia are different from the others but still resemble the similarity of the lipid profile.
According to Oliveira et al. (2015), at least five variables and five samples need to be part of the dataset for PCA. As can be seen from other authors, this reduced number of available samples is not closely associated with fatty acid markers as clusters of these samples. The PCA demonstrates which fatty acids have impacted to differentiate samples from different nationalities and, consequently, the genetic characteristics of each grain (Bari et al., 2021).
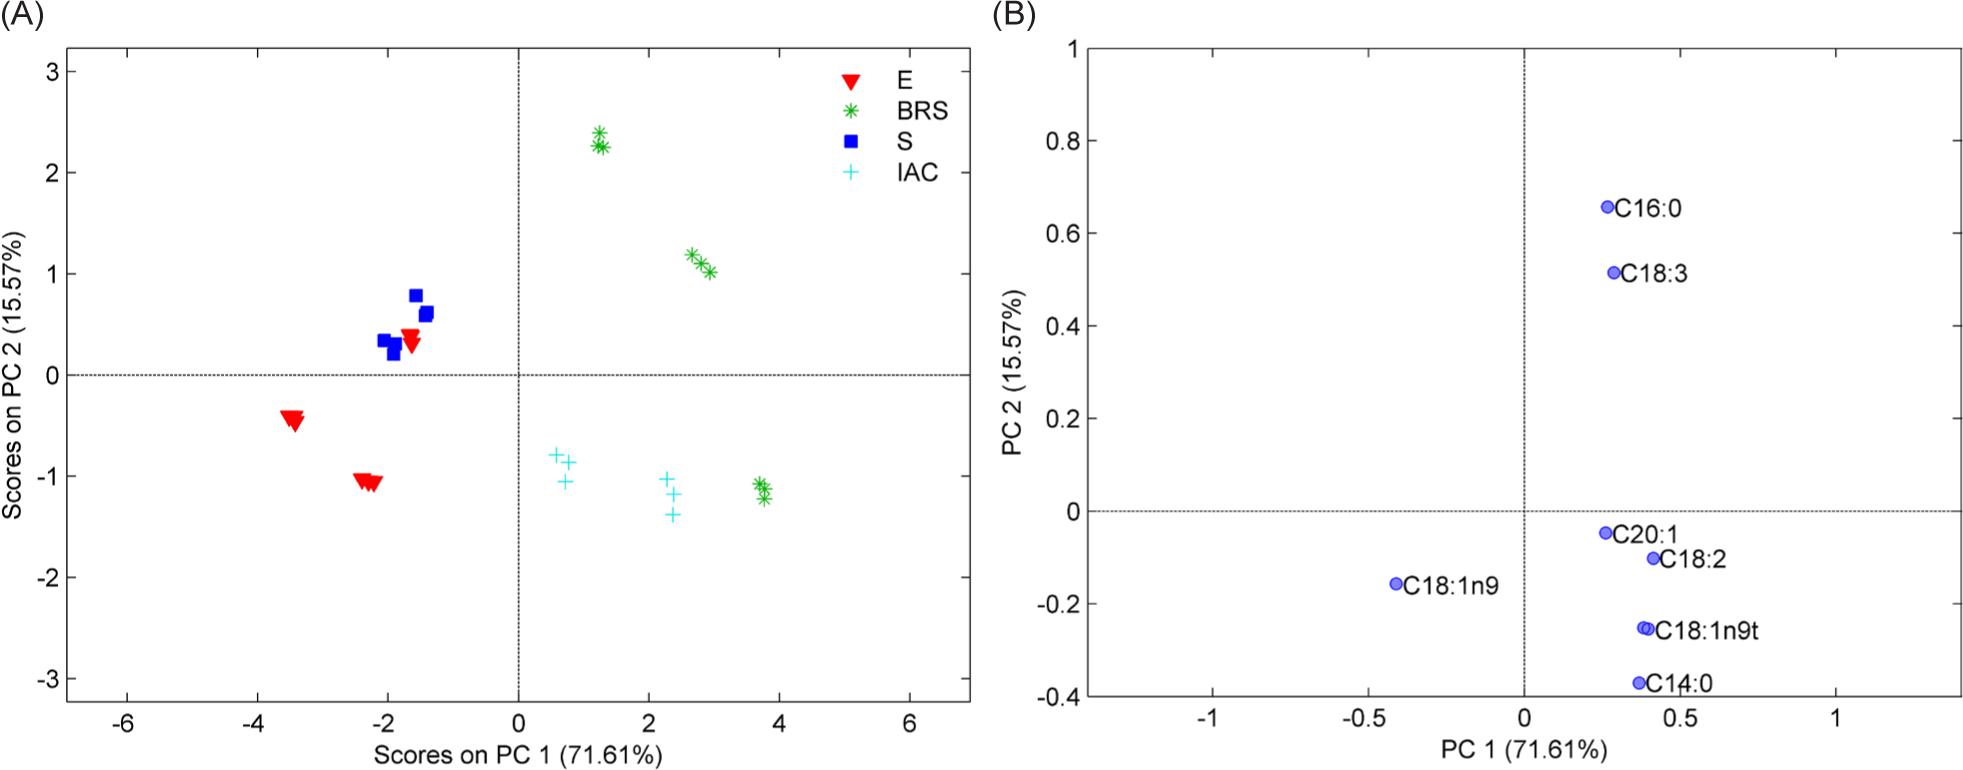
Three PCs explained 87.18% of the data variance, and three groups were observed using PCA for triticale (Figure 3). All samples were developed in Brazil. The dominant variables for PC1 were palmitic acid (C16:0) and linolenic acid (C18:3), which positively separated BRS samples developed by Embrapa. Some Embrapa samples (BRS) have similar lipid profile to IAC samples developed by the Agronomic Institute of Campinas, and cis-11-eicosenoic acid (C20:1), linoleic acid (C18:2), oleic acid (C18:1n9), and myristic acid (C14:0), responsible for the positive grouping of these samples by PC1 and negatively by PC2 in loadings graph. The oleic acid (C18:1n9) was decisive for the negative separation by PC1 from other Embrapa samples (called E and S). As observed in other studies, triticale has a poor fatty acid profile compared to quinoa and amaranth. However, it was sufficient to differentiate the samples, emphasizing fatty acids in more significant amounts, C18:1 and C18:2, IAC samples (Athukorala and Mazza, 2010).
Figure 3. Triticale plot Scores (A) and Loadings (B) on 2PC (87.18% variance).
E: series; BRS: series; S: Saturno; IAC: series (Table 1).
The pattern recognition method allows the grouping of fatty acid–related samples, directing these grains to their nutritional and technological functions (Ferreira, 2015; Pereira et al., 2019), as well as identifying product adulterations through these markers (Amiry et al., 2017; Yeganeh-Zare et al., 2022).
The advantage of the unsupervised method is that we do not have prior information on the samples, and these are grouped and/or naturally separated, only with available instrumental data; in this case, gas chromatography (Farag et al., 2016).
Hierarchical cluster analysis
In this study, a matrix of 96 × 14 (samples with triplicate × fatty acids) was formed by the relative area of the peak from the chromatogram of the quinoa, amaranth, and triticale grains, as calculated by Tavoletti et al. (2018).
HCA is plotted as a heatmap combined with a dendrogram, which also reduces the dimensionality of the data and allows them to group similar samples and detect the samples with anomalous behavior. It was possible to maximize the internal homogeneity of the groups and the heterogeneity between the groups. The dendrogram shown in Figure 4 demonstrates the similarity between grains through the lengths of the tree’s branches. It is a method of agglomeration, in which each sample is a unitary group and continues to group systematically in order of similarity. The similarity was calculated through the distance between the samples, applying Euclidean distance, calculated mathematically as the distance between two points: A = (a1,a2) and B = (b1,b2) (Medina et al., 2010) (Eq. 1):
To know the similarity ratio (SAB) between A and B, the distance between them was related to the most distant group (Eq. 2)
dAB is the distance between two groups, and dmax is the distance between the most distant groups from the dataset. The fatty acid content was associated with the colors blue-white-red, as minimum-medium-maximum. First, the samples were approached according to the species, with the well-defined tree groups. Observing as a whole, the composition of some fatty acids was similar for amaranth and triticale. As suggested by Shi et al. (2022), the heatmap also reinforces the difference between the samples. In addition, it was able to map all the grains together. Quinoa samples have variability in the content of C18:1, C14:0, and C18:3 (multicolored). While some varieties had higher values of C24:0, C22:0, and C14:0 (intense red). Amaranth varieties have a high content of C18:0 and C18:1. Moreover, triticale varieties that are less expressive demonstrated high content of C18:2. HCA was also applied by Medina et al. (2011) to quinoa samples from Europe and, like this study, found several groups for quinoa varieties.
Figure 4. A hierarchical cluster with a heat map of the quinoa, amaranth, and triticale using fatty acids.
Conclusions
This study attempted to distinguish the geographical origin of Adean grains, quinoa, amaranth varieties, and a manufactured hybrid, triticale, using lipid content, fatty acids profile, and chemometric tools. The quinoa grain had the most incredible variety of fatty acids (identified 14) relative to amaranth (11 identified) and triticale (8 identified). Quinoa and amaranth varieties developed by Embrapa presented more significant lipid content than the varieties of other countries and were always grouped in PCA. The loadings of PCA could determine which fatty acid is vital to group the varieties, emphasizing polyunsaturated acids in greater quantity, besides linoleic and eicosenoic acids correlated to quinoa, stearic palmitic acids to amaranth, and linolenic and oleic to triticale. However, identifying their geographical origin was unclear because the fatty acid composition in grains depends on the soil, climate conditions, season of the crop, and genetic enhancement. Through HCA, it was possible to confirm the fatty acids that impact the grouping of these grains. In addition, several other classes appeared in the heatmap for these grains. The results reported in this study can positively impact food technology since the fatty acids profile provide information to develop new and healthy products for specific technological, agricultural, or nutritional destinations. In conclusion, PCA and Heatmap allow the mapping of these grains concerning the fatty acid profile, but further studies with a more significant number of samples are needed to distinguish the origin more accurately.
Acknowledgments
The authors thank the National Council for Scientific and Technological Development (CNPq) and Coordination for the Improvement of Higher Education (CAPES) (Finance Code 001) for financial support.
REFERENCES
Alencar, N.M.M., Steel, C.J., Alvim, I.D., Morais, E.C, Bolini, H.M.A., 2015. Addition of quinoa and amaranth flour in gluten-free breads: temporal profile and instrumental analysis. LWT—Food Science and Technology 62(2): 1011–1018. 10.1016/j.lwt.2015.02.029
Amiry, S., Esmaiili, M. and Alizadeh, M., 2017. Classification of adulterated honeys by multivariate analysis. Food Chemistry 224: 390–397. 10.1016/j.foodchem.2016.12.025
AOAC, 1995. Official method of analysis. 16th ed. Association of Official Analytical Chemists, Method 923.03, AOAC International, Gaithersburg, MD.
Athukorala, Y. and Mazza, G., 2010. Supercritical carbon dioxide and hexane extraction of wax from triticale straw: content, composition and thermal properties. Industrial Crops and Produtcs 31(3): 550–556. Available at: https://www.sciencedirect.com/science/article/pii/S0926669010000440
Barba de la Rosa, A.P., Fomsgaard, I.S., Laursen, B., Mortensen, A.G., Olvera-Martínez, L., Mendoza-Herrera, A., González-Castañeda, J., De León-Rodriguez, A., 2009. Amaranth (Amaranthus hypochondriacus) as an alternative crop for sustainable food production: phenolic acids and flavonoids with potential impact on its nutraceutical quality. Journal of Cereal Science 49(1): 117–121. Available at: https://www.sciencedirect.com/science/article/pii/S0733521008001355
Bari, L.R., Ghanbari, A., Darvishzadeh, R., Giglou, M.T., Baneh, H.D., 2021. Discernment of grape rootstocks based on their response to salt stress using selected characteristics in combination with chemometric tools. Food Chemistry 365: 130408. 10.1016/j.foodchem.2021.130408
Bligh, E.G. and Dyer, W.J., 1959. A rapid method of total lipid extraction and purification. Canadian Journal of Biochemistry and Physiology 37(8): 911–917. Available at: https://cdnsciencepub.com/doi/10.1139/o59-099
Çevik, A. and Ertaş, N., 2019. Effect of quinoa, buckwheat and lupine on nutritional properties and consumer preferences of tarhana. Quality Assurance and Safety of Crops & Foods 11(2): 145–155. 10.3920/QAS2018.1305
Corke, H., Cai, Y.Z. and Wu, H.X., 2016. Amaranth: overview. Reference module in food science. Food Science: Elsevier. Available at: https://www.sciencedirect.com/science/article/pii/B9780081005965000329.
Dias, B.V., Gomes, S.V., Castro, M.L.C, Carvalho, L.C.F., Breguez, G.S., Souza, D.M.S., et al., 2022. EPA/DHA and linseed oil have different effects on liver and adipose tissue in rats fed with a high-fat diet. Prostaglandins & Other Lipid Mediators 159: 1098–8823. 10.1016/j.prostaglandins.2022.106622
FAOSTAT, 2022. Statistics division of food and agriculture organization of the United Nations. Food and Agriculture Organization of the United Nations, Rome. Available at: http://www.fao.org/faostat/en/#data/QC
Farag, M.A., Ezzat, S.M., Salama, M.M., Tadros, M.G., 2016. Anti-acetylcholinesterase potential and metabolome classification of 4 Ocimum species as determined via UPLC/qTOF/MS and chemometric tools. Journal of Pharmaceutical and Biomedical Analysis 125: 292–302. Available at: https://www.sciencedirect.com/science/article/pii/S0731708516301558
Ferreira, M., 2015. Quimiometria: conceitos, métodos e aplicações. Ed. Unicamp Ed., Campinas, SP.
Filho, A.M.M., Pirozi, M.R., Borges, J.T.S., Sant’Ana, H.M.P., Chaves, J.B.P., Coimbra, J.S.R., 2017. Quinoa: nutritional, functional, and antinutritional aspects. CRC Critical Reviews in Food Science and Nutrition 57(8): 1618–1630. Available at: https://pubmed.ncbi.nlm.nih.gov/26114306/
Fraś, A., Gołębiewska, K., Gołębiewski, D., Mańkowski, D., Boros, D., Szecówka, P., 2016. Variability in the chemical composition of triticale grain, flour and bread. Journal of Cereal Science 71: 66–72. Available at: https://www.sciencedirect.com/science/article/pii/S0733521016301229
Fraś, A., Gołębiewski, D., Gołębiewska, K., Mańkowski, D.R., Gzowska, M., Boros, D., 2018. Triticale-oat bread as a new product rich in bioactive and nutrient components. Journal of Cereal Science 82: 146–154. Available at: https://www.sciencedirect.com/science/article/pii/S0733521017302965.
Halford, N.G., Curtis, T.Y., Chen, Z., Huang, J., 2015. Effects of abiotic stress and crop management on cereal grain composition: implications for food quality and safety. Journal of Experimental Botany 66(5): 1145–1156. Available at: https://www.ncbi.nlm.nih.gov/pmc/articles/PMC4438447/
Hamilton, J.S. and Klett, E.L., 2021. Linoleic acid and the regulation of glucose homeostasis: a review of the evidence. Prostaglandins, Leukotrienes and Essential Fatty Acids 175: 102366. 10.1016/j.plefa.2021.102366
Hartman, L. and Lago, R.C., 1973. Rapid preparation of fatty acid methyl esters from lipids. Laboratory Practice 22(6): 475–476. Available at: https://pubmed.ncbi.nlm.nih.gov/4727126/
Hlinková, A., Bednárová, A., Havrlentová, M., Šupová, J., Čičová, I., 2013. Evaluation of fatty acid composition among selected amaranth grains grown in two consecutive years. Biologia 68(4): 641–650. Available at: https://link.springer.com/article/10.2478/s11756-013-0190-6
Jahaniaval, F., Kakuda, Y. and Marcone, M.F., 2000. Fatty acid and triacylglycerol compositions of seed oils of five Amaranthus accessions and their comparison to other oils. JAOCS, Journal of the American Oil Chemists’ Society 77(8): 847–852. 10.1007/s11746-000-0135-0
Jonnala, R.S., Irmak, S., MacRitchie, F., Bean, S.R., 2010. Phenolics in the bran of waxy wheat and triticale lines. Journal of Cereal Science 52(3): 509–515. 10.1016/j.jcs.2010.07.013
Khandaker, L., Akond, A.S.M.G.M., Ali, M.B., Oba, S., 2010. Biomass yield and accumulations of bioactive compounds in red amaranth (Amaranthus tricolor L.) grown under different colored shade polyethylene in spring season. Scientia Horticulturae 123(3): 289–294. 10.1016/j.scienta.2009.09.012
Kurek, M.A., Karp, S., Wyrwisz, J., Niu, Y., 2018. Physicochemical properties of dietary fibers extracted from gluten-free sources: quinoa (Chenopodium quinoa), amaranth (Amaranthus caudatus) and millet (Panicum miliaceum). Food Hydrocolloids 85: 321–330. 10.1016/j.foodhyd.2018.07.021
Laroussi-Mezghani, S., Vanloot, P., Molinet, J., Dupuy, N., Hammami, M., Grati-Kamoun, N., Artaud, J., 2015. Authentication of Tunisian virgin olive oils by chemometric analysis of fatty acid compositions and NIR spectra. Comparison with Maghrebian and French virgin olive oils. Food Chemistry 173: 122–132. 10.1016/j.foodchem.2014.10.002
Lee, J.-H., Kim, Y.-G., Park, J.G., Lee, J., 2017. Supercritical fluid extracts of Moringa oleifera and their unsaturated fatty acid components inhibit biofilm formation by Staphylococcus aureus. Food Control 80: 74–82. 10.1016/j.foodcont.2017.04.035
Li, B., Zhao, L., Xu, B., Deng, B., Liu, Y., Dong, Y., 2018. Rice bran real-time stabilization technology with flowing microwave radiation: its impact on rancidity and some bioactive compounds. Quality Assurance and Safety of Crops & Foods 10(1): 25–34. 10.3920/QAS2016.0982
Luo, X., Du, Z., Yang, K., Wang, J., Zhou, J., Liu, J., Chen, Z., 2021. Effect of electron beam irradiation on phytochemical composition, lipase activity and fatty acid of quinoa. Journal of Cereal Science 98: 103161. 10.1016/j.jcs.2021.103161
Manley, M., Downey, G. and Baeten, V., 2008. Spectroscopic technique: near-infrared (NIR) spectroscopy. In: Sun, D. (ed.) Modern techniques for food authentication. Elsevier, London, pp. 65–115. Available at: https://www.elsevier.com/books/modern-techniques-for-food-authentication/sun/978-0-12-814264-6
Medina, W., Skurtys, O. and Aguilera, J.M., 2010. Study on image analysis application for identification Quinoa seeds (Chenopodium quinoa Willd) geographical provenance. LWT—Food Science and Technology 43(2): 238–246. 10.1016/j.lwt.2009.07.010
Mergoum, M., 2009. Triticale: a “new” crop with old challenges. In: Carena, M. (ed.) Handbook of plant breeding, vol 3. Springer, New York. Available at: https://link.springer.com/chapter/10.1007/978-0-387-72297-9_9
Mohammadi, S.A. and Prasanna, B.M., 2003. Analysis of genetic diversity in crop plants—salient statistical tools and considerations. Crop Science 43(4): 1235–1248. 10.2135/cropsci2003.1235
Mouithys-Mickalad, A., Tome, N.M., Boogaard, T., Serteyn, D., Schmitt, E., Paul, A., 2021. Evaluation of the fat oxidation quality of commercial Hermetia illucens meal. Journal of Insects as Food and Feed 7(6): 965–974. 10.3920/JIFF2021.0001
Naes, T., Isaksson, T., Fearm, T., Davies, T., 2002. A user-friendly guide to multivariate calibration and classification. Cambridge Eds NIR Publications, 352 p. 10.1255/978-1-906715-25-0
Navruz-Varli, S. and Sanlier, N., 2016. Nutritional and health benefits of quinoa (Chenopodium quinoa Willd.). Journal of Cereal Science 69: 371–376. 10.1016/j.jcs.2016.05.004
Nsimba, R.Y., Kikuzaki, H. and Konishi, Y., 2008. Antioxidant activity of various extracts and fractions of Chenopodium quinoa and Amaranthus spp. seeds. Food Chemistry 106(2): 760–766. 10.1016/j.foodchem.2007.06.004
Oliveira, C.C., Calado, V.M.A., Ares, G., Granato, D., 2015. Statistical approaches to assess the association between phenolic compounds and the in vitro antioxidant activity of Camellia sinensis and Ilex paraguariensis teas. Critical Reviews in Food Science and Nutrition 55(10): 1456–1473. Available at: https://pubmed.ncbi.nlm.nih.gov/24918265/
Pereira, E., Encina-Zelada, C., Barros, L., Gonzales-Barron, U., Cadavez, V., Ferreira, I.C.F.R., 2019. Chemical and nutritional characterization of Chenopodium quinoa Willd (quinoa) grains: a good alternative to nutritious food. Food Chemistry 280: 110–114. 10.1016/j.foodchem.2018.12.068
Peter, K. and Gandhi, P., 2017. Rediscovering the therapeutic potential of Amaranthus species: a review. Egyptian Journal of Basic and Applied Sciences 4(3): 196–205. 10.1016/j.ejbas.2017.05.001
Rabbani, G., Baig, M.H., Jan, A.T., Lee, E.J., Khan, M.V., Zaman, M., Farouk, A.-E., Khan, R.H., Choi, I., 2017. Binding of erucic acid with human serum albumin using a spectroscopic and molecular docking study. International Journal of Biological Macromolecules 105: 1572–1580. 10.1016/j.ijbiomac.2017.04.051
Rakha, A., Åman, P. and Andersson, R., 2011. Dietary fiber in triticale grain: variation in content, composition, and molecular weight distribution of extractable components. Journal of Cereal Science 54(3): 324–331. 10.1016/j.jcs.2011.06.010
Ribeiro, M.D.M.M., Arellano, D.B. and Grosso, C.R.F., 2012. The effect of adding oleic acid in the production of stearic acid-lipid microparticles with a hydrophilic core by a spray-cooling process. Food Research International 47(1): 38–44. 10.1016/j.foodres.2012.01.007
Rustan, A.C. and Drevon, C.A., 2005. Fatty acids: structures and properties. John Wiley & Sons. 10.1038/npg.els.0000715
Savitzky, A. and Golay, M.J.E., 1964. Smoothing and differentiation of data by simplified least squares procedures. Analytical Chemistry 36(8): 1627–1639. 10.1021/ac60214a047
Shi, T., Wu, G., Jin, Q., Wang, X., 2022. Camellia oil adulteration detection using fatty acid ratios and tocopherol compositions with chemometrics. Food Control 133: 108565. 10.1016/j.foodcont.2021.108565
Singh, R.J. and Jauhar, P.P., 2006. Triticale: a Low-input cereal with untapped potential. In: Singh, R.J. and Jauhar, P.P. (eds.) Genetic resource, chromosome engineering, and crop improvement. CRC Press, Taylor & Francis, Boca Raton, p. 43. 10.1201/9780203489260.CH13
Tang, Y.L.X., Li, X., Chen, P.X., Zhang, B., Hernandez, M., Zhang, H., Marcone, M.F., Liu, R., Tsao, R., 2015. Characterization of fatty acid, carotenoid, tocopherol/tocotrienol compositions and antioxidant activities in seeds of three Chenopodium quinoa Willd. genotypes. Food Chemistry 174:502–508. 10.1016/j.foodchem.2014.11.040
Tavoletti, S., Foligni, R., Mozzon, M., Pasquini, M., 2018. Comparison between fatty acid profiles of old and modern varieties of T. turgidum and T. aestivum: a case study in central Italy. Journal of Cereal Science 82: 198–205. 10.1016/j.jcs.2018.06.012
Tomasi, G., Savorani, F. and Engelsen, S.B., 2011. icoshift: an effective tool for the alignment of chromatographic data. Journal of Chromatography A 1218(43): 7832–7840. 10.1016/j.chroma.2011.08.086
Turkut, G.M., Cakmak, H., Kumcuoglu, S., Tavman, S., 2016. Effect of quinoa flour on gluten-free bread batter rheology and bread quality. Journal of Cereal Science 69: 174–181. 10.1016/j.jcs.2016.03.005
Urquizo, F.E.L., Torres, S.M.G., Tolonen, T., Jaakkola, M., Pena-Niebuhr, M.G., Wright, A.V., Carrasco-Valencia, R.R., Korhonen, H., Plumed-Ferrer, C., 2017. Development of a fermented quinoa-based beverage. Food Science & Nutrition 5(3): 602–608. 10.1002/fsn3.436
Valencia-Chamorro, S.A., 2016. Quinoa. Reference module in food science. Food Science 1:np. 10.1016/B978-0-08-100596-5.00041-X
Vilcacundo, R. and Hernández-Ledesma, B., 2017. Nutritional and biological value of quinoa (Chenopodium quinoa Willd.). Current Opinion in Food Science 14: 1–6. 10.1016/j.cofs.2016.11.007
Yeganeh-Zare, S., Farhadi, K. and Amiri, S., 2022. Rapid detection of apple juice concentrate adulteration with date concentrate, fructose and glucose syrup using HPLC-RID incorporated with chemometric tools. Food Chemistry 370: 131015. 10.1016/j.foodchem.2021.131015
Zhu, F., 2018. Triticale: nutritional composition and food uses. Food Chemistry 241: 468–479. 10.1016/j.foodchem.2017.09.009