
Download


ORIGINAL ARTICLE
Screening and identification of antioxidant active ingredients from red wine via spectrum-effect relationship analysis
Yuye Gao1#, Xie-an Yu2#, Bing Wang2, Yibao Jin2, Guo Yin2, Jue Wang2, Yi Lu2, Tiejie Wang1,2, Kaishun Bi1*
1School of Pharmacy, Shenyang Pharmaceutical University, Shenyang, Liaoning, China;
2NMPA Key Laboratory for Quality Research and Evaluation of Traditional Chinese Medicine, Shenzhen Institute for Drug Control, Shenzhen, China
Abstract
Red wine was a prominent constituent of diets across the globe and modern pharmacological studies showed that red wine had the main function of antioxidant. However, the reported screening methods for active ingredients were inefficient and insensitive. In this research, 35 batches of red wine were used to establish the chromatography fingerprint, which were further utilized to screen and identify the antioxidant active ingredients through spectrum-effect relationship analysis. Indeed, the antioxidant capacity of red wine was evaluated by total antioxidant capacity assay kit (ABTS method). After evaluating the antioxidant capacity of samples, correlations were analyzed by Pearson correlation analysis, Spearman correlation analysis, and Gray Relational Analysis (GRA). Moreover, spectrum-effect relationships combined with ultrafast liquid chromatography/quadrupole-time-of-flight mass spectrometry (UFLC-Q-TOF/MS) revealed that the succinic acid, gallic acid, protocatechuic acid, catechin, syringic acid, salicylic acid, homogentisic acid, ellagic acid, isorhamnetin-3-O-glucoside, and trans- resveratrol show antioxidative efficacy. Collectively, the present study established the spectrum-effect relationship strategy of red wine and identified active antioxidant ingredients, which would give reasonable index components for the health function of red wine and provide reference for quick screening of bioactive compounds for food.
Key words: antioxidant activity, red wine, spectrum-effect relationship, UFLC-Q-TOF/MS
*Corresponding author: Kaishun Bi, School of Pharmacy, Shenyang Pharmaceutical University, Shenyang, Liaoning, China. Email: [email protected]
#These authors contributed equally.
Received: 17 February 2022; Accepted: 5 May 2022; Published: 1 January 2023
© 2023 Codon Publications
This is an Open Access article distributed under the terms of the Creative Commons Attribution-NonCommercial-ShareAlike 4.0 International (CC BY-NC-SA 4.0). License (http://creativecommons.org/licenses/by-nc-sa/4.0/)
Introduction
Wine is the product of the complete or partial fermentation of fresh grapes, or a mixture of that product and products derived solely from grapes, and a fermented wine with a certain degree of alcohol (Australia New Zealand Food Standards Code, 2004). Wine is classified by color into red wine, white wine, rose wine, and so on. Red wine showed higher antioxidant capacity compared with other type of wines (Fernández-Pachón et al., 2006). Polyphenol was the main bioactive compound in wine, including phenolic acids and flavonoids such as succinic acid, gallic acid, protocatechuic acid, catechin, syringic acid, salicylic acid, homogentisic acid, ellagic acid, transresveratrol, and isorhamnetin-3-O-glucoside, which shows antioxidant, anticoagulant, and lipid-lowering activities (Gao et al., 2021; Haunschild Robin and Marx Werner, 2022). Antioxidant activity was one of the most important biological activities of red wine; therefore, it is important to explore the specific antioxidant activity from red wine.
The spectrum-effect relationship was a subject that established the internal relationship between fingerprint and biochemical detection by multiple data processing methods, which was used to evaluate the internal quality (Rao et al., 2022; Zhang et al., 2018). Chromatography fingerprint had been internationally recognized as a feasible and reasonable quality evaluation method for traditional Chinese medicine, food and their related products with multi-components (Esteki et al., 2019). World Health Organization (WHO) (Guidelines for the assessment of herbal medicines, 1991) and US Food and Drug Administration (FDA) (Botanical Drug Development Guidance for Industry, 2016) have included and promoted chromatographic fingerprint as the reliable method for the quality control (Chen et al., 2019; Yang et al., 2016). Some studies have shown that suitable intake of red wine can reduce oxidative stress damage caused by free radicals (Navajas-Porras et al., 2020; Plumb et al., 2020). Therefore, antioxidant capacity was frequently used to evaluate the intrinsic quality of red wine (Eke et al., 2021). Currently, in vitro antioxidant screening methods are frequently used due to their high-throughput and low-cost characteristics (El-Demerdash Fatma et al., 2021). Among these methods, the stable solid-free radical 2,2’-azino-bis (3-ethylbenzothiazoline-6-sulfonic acid) (ABTS) was employed in the assessment of antioxidant activity. During the relationship analysis, correlation analysis was a statistical method used to calculate correlation coefficient, which can reflect the order of contribution for each chromatographic fingerprint peak component to activity. Some studies have developed the relationship between chromatographic fingerprint and antioxidant activity, which could provide not only a method for screening active ingredients but also a comprehensive strategy for quality evaluation (Du et al., 2021; Xu et al., 2022). Accordingly, the spectrum-effect relationship could be used for quick screening of the potential active ingredients from complex samples.
To further elucidate the material basis of the antioxidant effect from red wine, 35 batches of red wine were used to establish the ultra-high-performance liquid chromatography (UHPLC) fingerprint and the antioxidant activity of them was also evaluated through total antioxidant capacity assay kit with ABTS method. Then, the correlation between common peaks and the result of antioxidant activity was calculated by Pearson correlation analysis, Spearman correlation analysis, and Gray Relational Analysis (GRA). Following the results of spectrum-effect relationships and ultrafast liquid chromatography/ quadrupole-time-of-flight mass spectrometry (UFLC-QTOF/MS), succinic acid, gallic acid, protocatechuic acid, catechin, syringic acid, salicylic acid, homogentisic acid, ellagic acid, isorhamnetin-3-O-glucoside, and transresveratrol with the principally antioxidative substances were successfully screened. Hence, the present study established the spectrum-effect relationship strategy of red wine and identified active antioxidant ingredients, which would provide reference for quick screening of bioactive compounds from complex samples.
Materials and Methods
Reagents and chemicals
HPLC-grade acetonitrile (ACN) and methanol (MeOH) were purchased from Merck (Darmstadt, Germany). Trifluoroacetic acid (TFA) was obtained from Guangzhou Chemical Reagent Factory (Guangzhou, China). The water used in this study was purified by a Milli-Q water purification system (MA, USA). A total of 35 batches of red wine samples were collected from four countries, which included three grape varieties (Table 1). Total anti-oxidant capacity assay kit (ABTS) was purchased from Beyotime, Shanghai, China.
Table 1. Origin and varietal of the red wines tested.
| Samples | Cultivar(s) | Location |
|---|---|---|
| S1 | Cabernet Sauvignon | Maipo Valley, Chile (33°27’S; 70°40’W) |
| S2 | Cabernet Sauvignon | The Central Valley of Chile (33°27’S; 70°40’W) |
| S3 | Cabernet Sauvignon | Maipo Valley, Chile (33°27’S; 70°40’W) |
| S4 | Cabernet Sauvignon | Maipo Valley and Aconcagua Valley, Chile (33°27’S; 70°40’W and 32°29’S; 70°01’W) |
| S5 | Cabernet Sauvignon | Aconcagua Valley, Chile (32°29’S; 70°01’W) |
| S6 | Cabernet Sauvignon | Mendoza, Argentina (32°53’S; 68°51’W) |
| S7 | Cabernet Sauvignon | Mendoza, Argentina (32°53’S; 68°51’W) |
| S8 | Cabernet Sauvignon | Mendoza, Argentina (32°53’S; 68°51’W) |
| S9 | Cabernet Sauvignon | Mendoza, Argentina (32°53’S; 68°51’W) |
| S10 | Cabernet Sauvignon | Mendoza, Argentina (32°53’S; 68°51’W) |
| S11 | Cabernet Sauvignon | Clare Valley, Australia (33°50’S; 138°36’E) |
| S12 | Cabernet Sauvignon | Limestone Coast, Australia (30°20’S; 135°93’E) |
| S13 | Cabernet Sauvignon | South Australia (33°40’S; 135°80’E) |
| S14 | Cabernet Sauvignon | South Australia (33°40’S; 135°80’E) |
| S15 | Cabernet Sauvignon | Clare Valley, Australia (33°50’S; 138°36’E) |
| S16 | Cabernet Sauvignon | Changyu Vineyard, China (37°45’N; 121°43’E) |
| S17 | Cabernet Sauvignon | Ganchengzi District, Qingtongxia, Ningxia, China (38°01’N; 106°04’E) |
| S18 | Cabernet Sauvignon | Ningxia Helan Mountain East Foot Production Area, China (38°33’N; 106°20’E) |
| S19 | Cabernet Sauvignon | Changyu Vineyard, China (37°45’N; 121°43’E) |
| S20 | Cabernet Sauvignon | Changyu Vineyard, China (37°45’N; 121°43’E) |
| S21 | Shiraz | Limestone Coast of Australia (30°20’S; 135°93’E) |
| S22 | Shiraz | Great West, Australia (34°22’S; 117°60’E) |
| S23 | Shiraz | Hunter Valley, Australia (33°30’S; 151°40’E) |
| S24 | Shiraz | South Australia (33°40’S; 135°80’E) |
| S25 | Shiraz | Barossa, Australia (34°30’S; 137°80’E) |
| S26 | Shiraz | Pertway, Australia (36°50’S; 140°70’E) |
| S27 | Shiraz | Kunawala, Australia (36°40’S; 140°50’E) |
| S28 | Shiraz | Moray Valley, Chile (35°14’S; 71°27’W) |
| S29 | Shiraz | Espinal Vineyard, Chile (33°27’S; 70°40’W) |
| S30 | Shiraz | Pascual Toso, Argentina (32°53’S; 68°51’W) |
| S31 | Merlot | Cachabel Valley, Chile (33°89’S; 71°45’W) |
| S32 | Merlot | Curisco Valley, Chile (35°12’S; 71°31’W) |
| S33 | Merlot | Konggagua Valley, Chile (34°90’S; 71°50’W) |
| S34 | Merlot | Southeast Australia (33°40’S; 135°80’E) |
| S35 | Merlot | Southeast Australia (33°40’S; 135°80’E) |
Sample preparation
The red wine was analyzed immediately after it was opened. All red wine samples (2 mL) were filtrated through a 0.22 μm polyvinylidene fluoride membranes. All the samples were stored at 4°C in the dark prior to analysis.
UHPLC chromatographic analysis
The UHPLC analysis was performed by an UltiMate 3000 RSLCnano UltiMate 3000 RSLCnano System liquid chromatograph (Thermo Technologies, MA, USA) equipped with a Dionex UltiMate 3000 pump, a Dionex UltiMate 3000 autosampler, and a Dionex UltiMate 3000 diode array detector. The chromatographic separation of red wine was achieved on an ACQUITY UPLC column (HSS T3, 1.8 μm, 2.1 × 100 mm, Waters, Ireland) at 30°C. The mobile phase was composed of water containing 0.1% TFA (A) and methanol (B) at a flow rate of 0.30 mL/min. The fingerprint elution program was conducted as follows: 0–15 min at 0–6% B, 15–20 min at 6–11% B, 20–30 min at 1–11% B, 30–45 min at 11–20% B, 45–55 min at 20–30% B, and 55–60 min at 30–90% B. The sample injection volume was 2 μL and the total run time for analysis was 60 min. The DAD wavelength was 220 nm.
Similarity analysis
All chromatographic data of 35 batches of samples were exported as *.AIA file from UHPLC. Similarity analysis (SA) was performed on those files by using “Similarity Evaluation System for Chromatographic Fingerprint of Traditional Chinese Medicine” software (Version 2004A, Chinese Pharmacopoeia Committee). S1 was set as the reference fingerprint, and a new control fingerprint (R) was generated after multi-point correction and automatic matching, then the similarity values of these samples were calculated. In addition, the common peaks in UHPLC fingerprints were observed.
Antioxidant activity assay
The antioxidant activity of red wine was exhibited to restrict the absorbance of free radical cation ABTS, which showed a characteristic long-wavelength absorption spectrum with a maximum at 734 nm The ABTS radical was formed through a reaction with an oxidizing agent. Initially, 0.4 mL ABTS stock solution was mixed with 0.4 mL of the oxidizing agent solution for the preparation of the radical. This solution was maintained at room temperature for 12–16 h in an amber bottle. Subsequently, the mixture was diluted in phosphate-buffered saline (PBS) to obtain an absorbance of approximately 0.7 ± 0.05. Finally, different batches of red wine (10 μL) were added and the absorbance of all test tubes was determined at 734 nm (Spagnol et al., 2019).
Statistical analysis
The correlation analysis was conducted between the common peak areas and activity data of red wine by statistical analysis of the GRA, Pearson correlation coefficient, and Spearman correlation coefficient. SPSS 24.0 (International Business Machines Corporation, New York, USA) was used to process the data and find common peaks that were significantly related to pharmacological effects.
Mass spectrometry
The identification was performed on a hybrid quadrupole time-of-flight tandem mass spectrometry, UFLCQ-TOF/MS (X500R QTOF, AB SCIEX, Foster City, CA) equipped with an electrospray ionization (ESI) interface. The mass spectrometer was operated in the negative ion mode. The following parameter settings were used: the ion spray voltage of 7 eV, turbo spray temperature (TEM) of 550°C, declustering potential (DP) of –100 V, collision energy (CE) of –45 V, nebulizer gas (gas 1) of 55 psi, heater gas (gas 2) of 55 psi, and curtain gas of 35 psi. Nitrogen was kept as the nebulizer and auxiliary gas. TOF-MS and TOF-MS/MS were scanned with the mass range of m/z 100–1500 Da and 50–1500 Da, respectively. The experiments were run with 150 ms accumulation time for TOF MS and 50 ms accumulation time for TOF-MS/MS. Continuous recalibration was carried out at each five samples. In addition, dynamic background subtraction (DBS) trigger information-dependent acquisition (IDA) was used to trigger acquisition of MS/MS of low-level constituents. The accurate mass and composition for the precursor ions and fragment ions were analyzed using the SCIEX OS software integrated with the instrument.
Results and Discussion
Optimization of the chromatographic conditions
In order to obtain useful chemical information and better separation, several parameters including mobile phase composition, detection wavelength, and column temperature were carefully inspected as these parameters could positively influence the separation. The types and proportions of acid in the mobile phase were investigated. The conditions of adding 0.05% formic acid, 0.05% trifluoroacetic acid, 0.05% acetic acid, and pure water were also tested. As a result, 0.05% trifluoroacetic acid was better (Figure 1A). The conditions of adding 0.03% trifluoroacetic acid, 0.05% trifluoroacetic acid, and 0.1% trifluoroacetic acid in water were compared. The result showed that 0.1% trifluoroacetic acid was better (Figure 1B). The detection wavelength was tested at 210, 220, 254, and 280 nm. Under the wavelength of 220 nm, it was found that more detectable common peaks, larger response values, and smoother baseline could be observed (Figure 1C). The column temperatures of 25°C, 30°C, and 35°C were evaluated. The result showed that the peak separation at 30°C was better (Figure 1D). The optimization of the chromatographic conditions is shown in Figure 1 and the fingerprint spectrum is shown in Figure 2.
Figure 1. The optimization of the chromatographic conditions.
Figure 2. UHPLC fingerprint chromatogram of red wine.
Methodology validation
The analytical method was validated for precision, repeatability, and stability. In precision testing, six consecutive injections of one sample solution were performed on the same day. Precision of peak area (PA) and retention time (RT) of 41 common peaks did not exceed 5.61% and 1.82% in relative standard deviation (RSD), respectively. Six independent samples were extracted and determined in parallel for the evaluation of repeatability. The RSD of peak area and RT of 41 common peaks was less than 5.99% and 1.77%. The stability was assessed by repeatedly analyzing one sample solution after being placed at room temperature for 0, 2, 4, 8, 12, and 24 h. The RSD of PA and RT of 41 common peaks was less than 5.70% and 1.72%, respectively. These results indicated that the established UHPLC fingerprint method for red wine was stable and reliable.
UHPLC fingerprints of red wine and similarity evaluation
The fingerprints of 35 batches red wine were analyzed by similarity evaluation system. The values of similarity of generated reference fingerprint and sample fingerprints were calculated by similarity evaluation system. As a result, 41 common peaks were observed in UHPLC fingerprints (Figure 3). In Table 2, the similarity values between generated reference fingerprint and sample fingerprint were in the range of 0.445–0.972. According to the similarity evaluation system of chromatographic fingerprint of traditional Chinese medicine, the similarity between 0.9 and 1.0 was considered to meet the similarity requirement. These results demonstrated that there were differences between these samples. It was possible that the relative retention time (RT) or relative peak area (PA) of some peaks of red wine were not stably expressed, which might affect the antioxidant activity of red wine.
Figure 3. UHPLC fingerprints of different red wine samples.
Table 2. Similarity evaluation of 35 batches of red wine samples.
| Sample No. | Similarity | Sample No. | Similarity |
|---|---|---|---|
| S1 | 0.886 | S19 | 0.754 |
| S2 | 0.916 | S20 | 0.848 |
| S3 | 0.824 | S21 | 0.912 |
| S4 | 0.870 | S22 | 0.940 |
| S5 | 0.914 | S23 | 0.775 |
| S6 | 0.959 | S24 | 0.913 |
| S7 | 0.812 | S25 | 0.905 |
| S8 | 0.936 | S26 | 0.935 |
| S9 | 0.936 | S27 | 0.871 |
| S10 | 0.947 | S28 | 0.821 |
| S11 | 0.946 | S29 | 0.836 |
| S12 | 0.934 | S30 | 0.901 |
| S13 | 0.920 | S31 | 0.852 |
| S14 | 0.946 | S32 | 0.928 |
| S15 | 0.972 | S33 | 0.890 |
| S16 | 0.445 | S34 | 0.504 |
| S17 | 0.863 | S35 | 0.767 |
| S18 | 0.918 | ||
Results of antioxidant activity
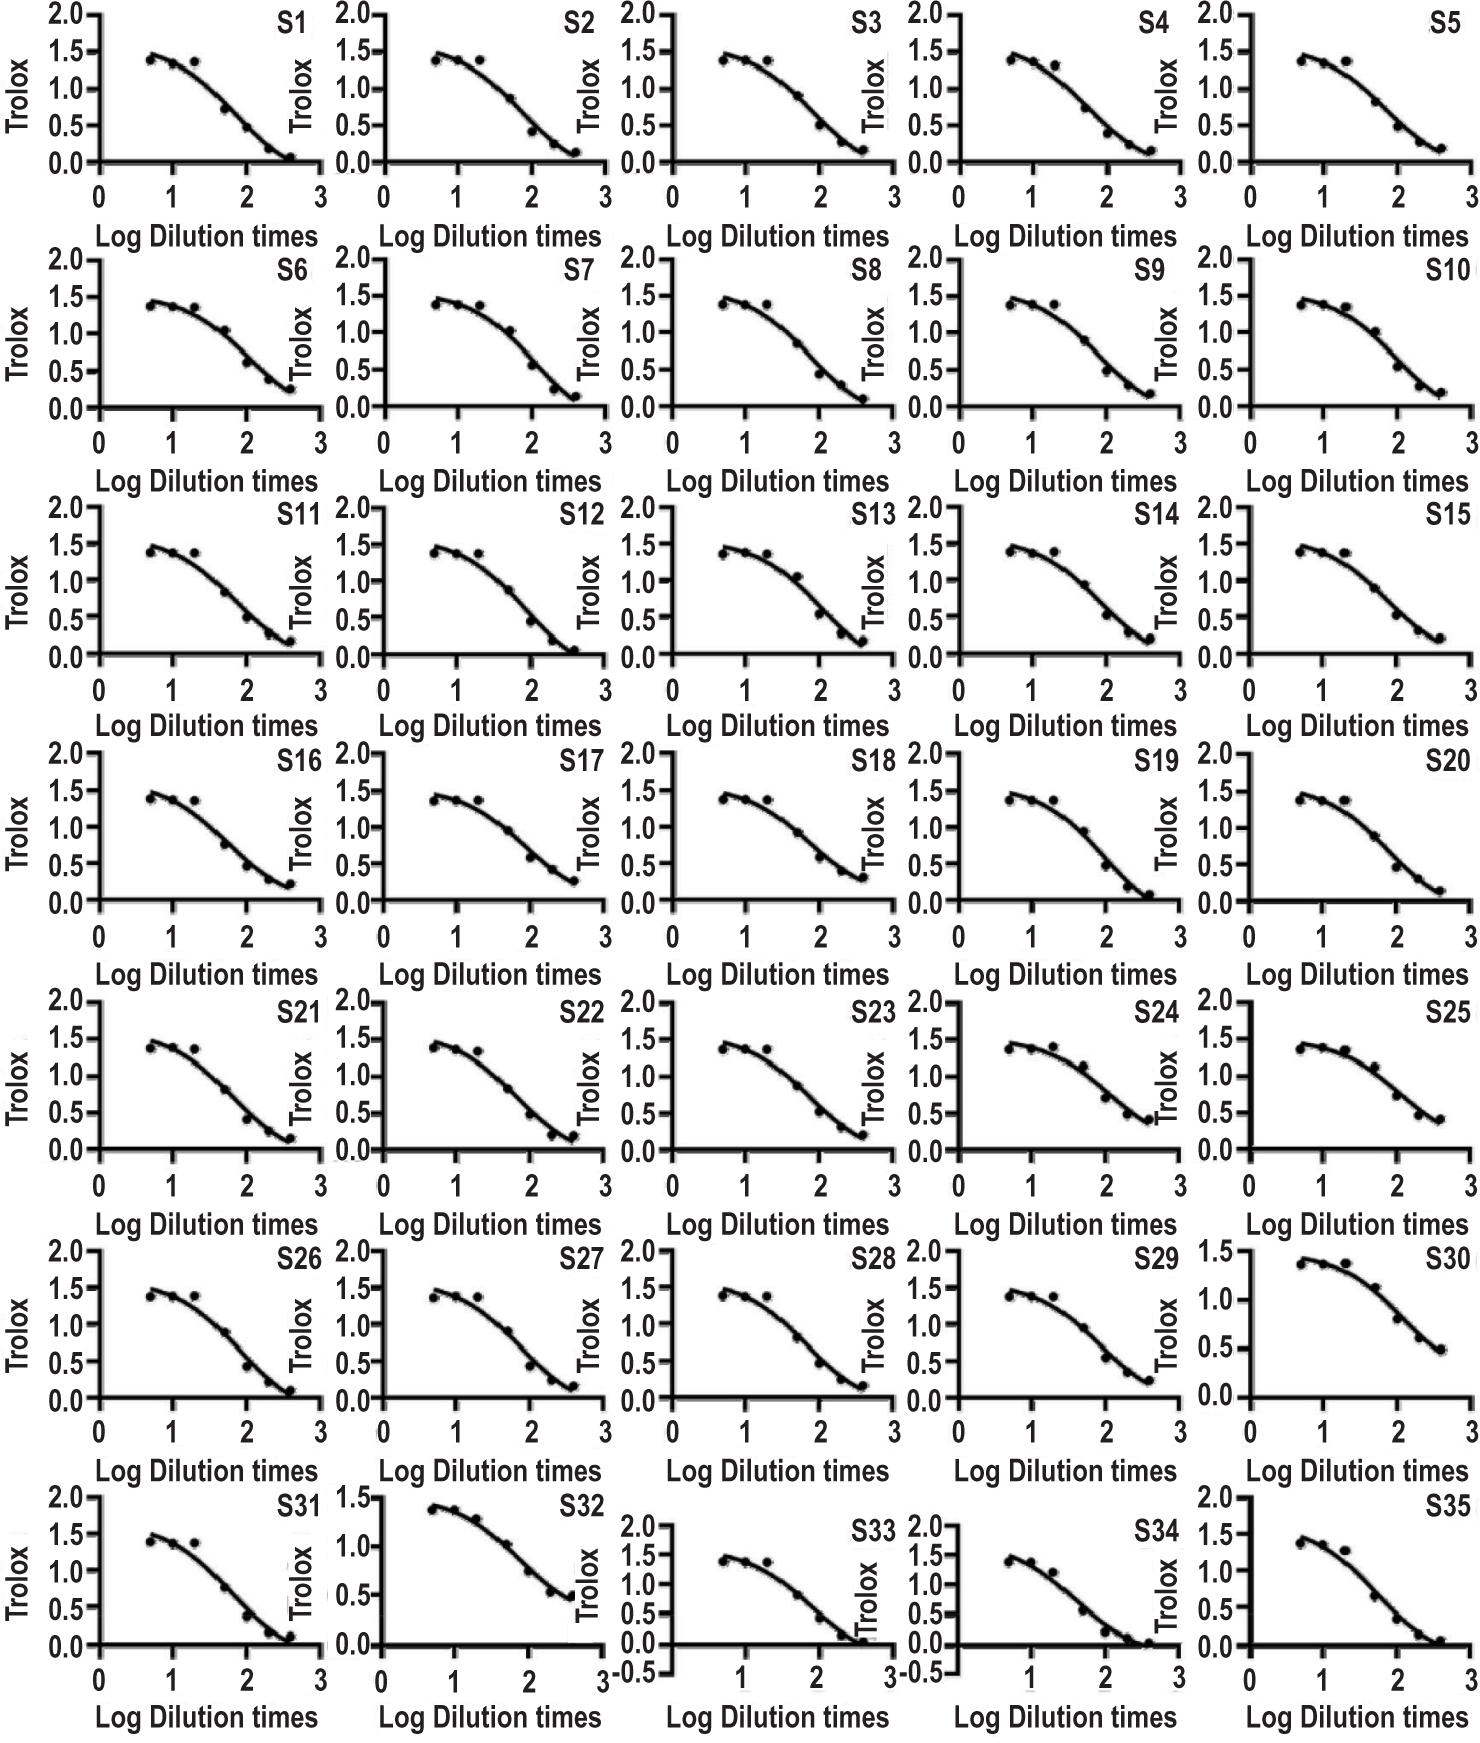
Antioxidant activity was one of the reasons why red wine was interested in food field. In this research, the antioxidant capacity of red wine was analyzed by ABTS scavenging assay and expressed as IC50. IC50 was inversely proportional to the antioxidant capacity of red wine. Thirty-five batches of red wine were diluted to 5, 10, 20, 50, 100, 200, and 400 times to evaluate the antioxidant activity. The result is shown in Figure 4. The IC50 values of antioxidant activity for ABTS were in the range of 52.66–114.4 times of dilution times, hence a higher IC50 of dilution times showed a stronger antioxidant capacity. The results given in Table 3 show that red wine has good antioxidant activity.
Figure 4. Determination of antioxidant activity of 35 batches of red wine.
Table 3. The IC50 value of red wine samples.
| Sample | IC50 | Sample | IC50 |
|---|---|---|---|
| S1 | 68.23 | S19 | 93.1 |
| S2 | 70.88 | S20 | 77.03 |
| S3 | 79.89 | S21 | 63.38 |
| S4 | 52.66 | S22 | 66.25 |
| S5 | 67.99 | S23 | 74.33 |
| S6 | 102.1 | S24 | 110.7 |
| S7 | 106.0 | S25 | 109.3 |
| S8 | 74.18 | S26 | 78.14 |
| S9 | 75.98 | S27 | 73.71 |
| S10 | 92.8 | S28 | 65.74 |
| S11 | 68.37 | S29 | 80.9 |
| S12 | 81.9 | S30 | 114.4 |
| S13 | 102.4 | S31 | 59.05 |
| S14 | 79.80 | S32 | 73.71 |
| S15 | 72.87 | S33 | 74.22 |
| S16 | 54.67 | S34 | 38.82 |
| S17 | 84.4 | S35 | 50.29 |
| S18 | 71.72 | ||
Results of correlation analysis
Correlation analysis can reflect the degree of correlation between variables. GRA, Pearson correlation, and Spearman correlation were used to examine the correlation of each peak and antioxidant activity directly; the closer the relationship between variables, the larger the absolute value of the correlation coefficient. The results of GRA show that the correlation coefficient from high to low as follows: P21 > P25 > P4 > P27 > P1 > P24 > P10 > P3 > P39 > P29 > P9 > P23 > P6 > P19 > P11 > P22 > P33 > P36 > P3 > P28 > P16 > P18 > P15 > P13 > P31 > P7 > P12 > P38 > P8 > P17 > P20 > P26 > P32 > P14 > P30. The larger correlation coefficients of P21, P25, P4, P27, P1, P24, and P10 of GRA were more than 0.95 suggesting that these seven peaks were closely related to antioxidant activity. The results of Pearson coefficient values were P24 > P25 > P27 > P38 > P39 > P29 > P21 > P33. Similarly, the results of Spearman coefficient values were P10 > P38 > P39 > P33 (Table 4). In the Pearson and Spearman correlation analysis, the correlations of P24, P25, P27, P38, P39, P29, P21, P33, and P10 were significant at the 0.05 level, P39 and P33 were significant at the 0.01 level, which show that these nine components play key roles in the antioxidant activity of red wine. Taken together, integrated the three correlation analysis methods via the correlation coefficient (>0.95) of GRA and P value (<0.05) of Pearson correlation coefficient and Spearman correlation coefficient. Thus, P4, P10, P21, P24, P38, P1, P25, P27, P29, P39, and P33 were selected as potential antioxidant active ingredients, which when increased in concentration may enhance the antioxidant effect of red wine. Furthermore, the red wine was analyzed by UFLCQ-TOF/MS and the chemical structures for 10 of the 11 screened compounds were identified.
Table 4. The results of GRA, Pearson, and Spearman correlation coefficient.
| GRA | Pearson correlation coefficient | Spearman correlation coefficient | |||||
|---|---|---|---|---|---|---|---|
| Peak no. | Correlation Coefficient | Peak no. | TEAC | Peak no. | TEAC | ||
| 21 | 0.961 | 10 | Correlation Coefficient | 0.406* | 24 | Correlation Coefficient | 0.359* |
| 25 | 0.96 | P value | 0.015 | P value | 0.034 | ||
| 4 | 0.959 | 38 | Correlation Coefficient | 0.364* | 25 | Correlation Coefficient | 0.391* |
| 27 | 0.957 | P value | 0.031 | P value | 0.02 | ||
| 1 | 0.954 | 39 | Correlation Coefficient | 0.467** | 27 | Correlation Coefficient | 0.391* |
| 24 | 0.953 | P value | 0.005 | P value | 0.02 | ||
| 10 | 0.951 | 33 | Correlation Coefficient | 0.450** | 38 | Correlation Coefficient | 0.356* |
| - | - | P value | 0.007 | P value | 0.036 | ||
| - | - | - | - | - | 39 | Correlation Coefficient | 0.454** |
| - | - | - | - | - | P value | 0.006 | |
| - | - | - | - | - | 29 | Correlation Coefficient | 0.411* |
| - | - | - | - | - | P value | 0.014 | |
| - | - | - | - | - | 21 | Correlation Coefficient | 0.357* |
| - | - | - | - | - | P value | 0.035 | |
| - | - | - | - | - | 33 | Correlation Coefficient | 0.403* |
| - | - | - | - | - | P value | 0.017 | |
*P<0.05; ** P<0.01.
UFLC-Q-TOF/MS analyses of red wine
According to the result of three correlation analysis methods (GRA, Pearson, and Spearman correlation coefficient) as explained in the previous section, the peaks P1, P4, P10, P21, P24, P25, P27, P29, P33, P38, and P39 were selected as potential antioxidant active ingredients. The potential active compounds were identified by UFLCQ-TOF/MS. The peak number, retention time, MS/MS fragmentation ions information, and identification of 10 components are listed in Table 5. The total ion chromatography is shown in Figure 5. Peak 1 has the major first-order mass spectrum at m/z 117.0194 (C4H6O4) [M–H]–. The MS/MS fragments are at 99.0094 (C3H6O3) [M–H–H2O]– and 73.0292 (C4H4O3) [M–H–CO2]–. Therefore, it is identified as succinic acid (Huang et al., 2012). Peak 4 shows the mass spectrum ion at m/z 169.0141 (C7H6O5) [M–H]– and the product ion at 125.0247 (C6H6O3) [M–H–CO2]– is also observed. As a result, it is identified as gallic acid (Gao et al., 2021). Peak 10 has a molecular weight of 153.1092 (C7H6O4) with a fragment of 109.0296 (C6H6O2) [M–H–CO2]–, and it is identified as protocatechuic acid (Ma et al., 2015). Peak 21 has an [M–H]– ion at m/z 289.0715 (C15H14O6), the MS/MS fragmentation ions are at 245.0849 (C13H14O4) [M–H–CO2]– and 203.0706 (C10H12O3) [M–H–C3H2O3]–, which is identified as catechin (Svoboda et al., 2015). Peak 24 shows the mass spectrum ion at m/z 197.0456 (C9H10O5) [M–H]–, the product ion at 123.0077 [M–H–2CH3–CO2]– (C6H4O3) is supported to surmise it as syringic acid (Gao et al., 2021). Peak 27 and Peak 29 have the major ions at m/z 137.0244 [M–H]– (C7H6O3) and 167.0351 [M–H]– (C8H8O4), both have missed a CO2 fragment, the MS/MS fragments are at 93.0345 [M–H–CO2]– (C6H6O) and 123.0450 [M–H–CO2]– (C7H8O2), Peak 29 has the other MS/ MS fragment at 81.0352 [M–H–CO2–C2H2O]– (C5H5O), which is identified as salicylic acid and homogentisic acid (Gao et al., 2021). Peak 33 shows the mass spectrum ion at 300.9987 [M–H]– (C14H6O8), the product fragment ions at 257.0110 [M–H–CO2]– (C13H6O6) and 229.0126 [M–H–CO2–CO]– (C12H6O5), constituting the structure of ellagic acid (Yan et al., 2014). Peak 38 has an [M–H]– ion at m/z 477.1044 (C22H22O12), the MS/MS fragmentation ions are at 315.0519 (C16H12O7) [M–H–C6H10O5]–, 271.0258 (C14H8O6) [M–H–C6H11O5–CH2–CHO]–, and 243.0308 (C13H8O5) [M–H–C6H11O5–CH2–CHO– CO]–, which is identified as isorhamnetin-3-O-glucoside (Tkacz et al., 2020). Peak 39 has the major ions at m/z 227.0717 [M–H]– (C14H12O3) and the MS/MS fragment at 143.0496 [M–H–2C2H2O]– (C10H6O). Therefore, it is identified as trans-resveratrol (Bai et al., 2021). Peak 25 is not identified by current qualitative analysis methods.
Table 5. UFLC-Q-TOF/MS data and identification of 11 compounds with antioxidant activity from red wine.
| Peak no. | RT (min) | [M-H]- | MS/MS fragmentation ions | Formula | Identification | ppm |
|---|---|---|---|---|---|---|
| 1 | 1.38 | 117.0194 | 99.0094, 73.0292 | C4H6O4 | Succinic acid | -1.2 |
| 4 | 5.92 | 169.0141 | 125.0247 | C7H6O5 | Gallic acid | -1.0 |
| 10 | 11.72 | 153.0192 | 109.0296 | C7H6O4 | Protocatechuic acid | 0.3 |
| 21 | 20.34 | 289.0715 | 245.0849, 203.0706, 123.0457, 109.0303 | C15H14O6 | Catechin | -1.5 |
| 24 | 22.06 | 197.0456 | 123.0077, 95.0134 | C9H10O5 | Syringic acid | -0.3 |
| 27 | 29.06 | 137.0244 | 93.0345 | C7H6O3 | Salicylic acid | 1.0 |
| 29 | 30.67 | 167.0351 | 123.0450, 83.0137, 81.0352 | C8H8O4 | Homogentisic acid | 0.8 |
| 33 | 38.70 | 300.9987 | 257.0110, 229.0126 | C14H6O8 | Ellagic acid | -0.9 |
| 38 | 45.61 | 477.1044 | 315.0519, 271.0258, 243.0308 | C22H22O12 | Isorhamnetin-3- O-glucoside | 0.6 |
| 39 | 47.17 | 227.0717 | 143.0496 | C14H12O3 | Trans-resveratrol | 0.6 |
Figure 5. UFLC-Q-TOF/MS chromatography in a negative mode.
The identified compounds are polyphenols, which were reported many times for their antioxidant activity, anticoagulant activity, and so on (Gao et al., 2021; Wang et al., 2022). Gallic acid increases the antioxidant enzyme activity and inhibits oxidative stress through a nuclear factor erythroid-2/nuclear factor kappa B-dependent (Nrf2/NF-κB-dependent) mechanism. In addition, gallic acid inhibits oxidative stress by increasing the expression of heme oxygenase-1 (HO-1) and Nrf2 genes, activating the signaling pathway of Nrf2/ HO-1, decreasing the expression of NF-κB, inhibiting NF-κB pathway, and exerting anti-inflammatory effects (Sohrabi et al., 2021). Protocatechuic acid plays an antioxidant role by increasing catalase and superoxide dismutase levels, reduces the level of glutathione and malondialdehyde (Albarakati, 2022). Syringic acid, salicylic acid, and ellagic acid exert the antioxidant capacity by activating Nrf2 (Lavigne et al., 2022; Somade et al., 2022; Zhang et al., 2022). Isorhamnetin-3-Oglucoside significantly increases the level of glutathione (GSH) and the expression level of antioxidant enzymes (including superoxide dismutase (SOD), catalase, glutathione reductase, and HO-1), preventing reactive oxygen species (ROS) induced cell damage (Kong et al., 2009). Trans-resveratrol inhibits the levels of m-RNA of inflammatory markers NF-κB and tumor necrosis factor α (TNF-α), reduces the concentration of creatine kinase (CK-MB), lactate dehydrogenase (LDH), and alkaline phosphatase, increases the concentration of superoxide dismutase and catalase, which plays an antioxidant role (Manjunatha et al., 2020). Catechins can repair oxidative damage at a certain degree to some extent by regulating the activity of key enzymes related to GSH pathway (Zhao et al., 2022). Some experiments showed that succinic acid and homogentisic acid have antioxidant activity (Al Khatib Maher et al., 2021; Zarubina et al., 2012), but the anti-oxidation mechanism has not been found. Therefore, comparison of our results to other researches shows that the screened compounds certainly have the antioxidant activity.
Confirmation of the antioxidant activity of the standards
In order to demonstrate the antioxidant capacity of the screened compounds, the antioxidant activity of the nine standards was determined. The antioxidant capacity of standards was analyzed by ABTS scavenging assay and expressed as IC50. The standards were formulated as reserve fluids. Gallic acid (990 μg/mL), protocatechuic acid (1005 μg/mL), catechin (502.5 μg/mL), syringic acid (1025 μg/mL), salicylic acid (1004 μg/mL), homogentisic acid (1025 μg/mL), ellagic acid (980 μg/mL), isorhamnetin-3-O-glucoside (495 μg/mL), and isorhamnetin-3-Oglucoside (992 μg/mL) were diluted to 1, 2, 4, 8, 16, 32, 64, 128, 256, and 512 times to evaluate the antioxidant activity. The results showed that the screened compounds and selected compounds have antioxidant activity. The IC50 values are displayed in Figure 6 and the results are given in Table 6. An external experiment verified the result of correlation analysis.
Figure 6. Determination of antioxidant activity of standards.
Table 6. The IC50 value of standards.
| Standards | IC50 (μg/mL) |
|---|---|
| Gallic acid | 188.71 |
| Protocatechuic acid | 129.84 |
| Catechin | 141.55 |
| Syringic acid | 222.97 |
| Salicylic acid | 383.79 |
| Homogentisic acid | 158.94 |
| Ellagic acid | 76.26 |
| Isorhamnetin-3-O-glucoside | 248.99 |
| Trans-resveratrol | 75.38 |
Conclusions
In this study, the antioxidant components of red wine were analyzed and partially identified using spectrum-effect relationship strategy and UFLC-Q-TOF/MS. The fingerprint of 35 batches were obtained using UHPLC and 41 common peaks were chosen through similarity analysis. Combined with the results of the ABTS assays, the spectrum-effect relationship was carried out to screen the active compounds. The results showed that the peaks with antioxidant components were P21, P24, P10, P38, P4, P27, P1, P39, P29, and P33, respectively. Finally, these peaks were identified as succinic acid, gallic acid, protocatechuic acid, catechin, syringic acid, salicylic acid, homogentisic acid, ellagic acid, isorhamnetin-3- O-glucoside, and trans-resveratrol through UFLC-QTOF/MS. Accordingly, the spectrum-effect relationship strategy was established and screened the antioxidant components from red wine, which could be used for quick screening of bioactive compounds from complex samples.
Author contributions
Conceptualization, Kaishun Bi; data collection and methodology, Yuye Gao, Xie-an Yu, Bing Wang, Yibao Jin, Guo Yin, Jue Wang, and Yi Lu; data analysis, Yuye Gao and Xie-an Yu; writing—original draft preparation, Yuye Gao and Xie-an Yu; writing—review and editing, Tiejie Wang and Kaishun Bi. All authors have read and agreed to the published version of the manuscript.
Acknowledgments
The authors would like to thank all the companions who selflessly supported this work.
Funding
This research was funded by National Natural Science Foundation of China (No. 82104357) and Shenzhen Science and Technology Program (No. JCYJ20210324130408021).
Conflicts of interest
The authors declare no conflicts of interest.
REFERENCES
Albarakati Alaa Jameel A. Protocatechuic acid counteracts oxidative stress and inflammation in carrageenan-induced paw edema in mice. Environ Sci Pollut Res Int. 2022 Aug;29(37):56393-56402. 10.1007/s11356-022-19688-9
Al Khatib Maher, Costa Jessica, Spinelli Daniele, Capecchi Eliana, Saladino Raffaele, Baratto Maria Camilla, et al. Homogentisic acid and gentisic acid biosynthesized pyomelanin mimics: Structural characterization and antioxidant activity. Int J Mol Sci. 2021;22(4):1739. 10.3390/ijms22041739
Australia New Zealand Food Standards Code - Standard 4.5.1 - Wine Production Requirements (Australia Only), https://www.legislation.gov.au/Details/F2011C00249; 2004 [Accessed
Bai Zhang-Zhen, Tang Jun-Man, Ni Jing, Zheng Tian-Tian, Zhou Yang, Sun Dao-Yang, et al. Comprehensive metabolite profile of multi-bioactive extract from tree peony (Paeonia ostii and Paeonia rockii) fruits based on MS/MS molecular networking. Food Res Int. 2021;148:110609. 10.1016/j.foodres.2021.110609
Chen Wenbin, Tu Xijuan, Wu Dehui, Gao Zhaosheng, Wu Siyuan, Huang Shaokang. Comparison of the partition efficiencies of multiple phenolic compounds contained in propolis in different modes of acetonitrile–water-based homogenous liquid–liquid extraction. Molecules. 2019;24(3):442. 10.3390/molecules24030442
Du Weifeng, Zhu Weihao, Ge Weihong, Li Changyu. Research on the effect of spleen-invigorating and anti-swelling active ingredients in crude and processed coix seed based on spectrum-effects relationship combined with chemometrics. J Pharm Biomed Anal. 2021;205:114350. 10.1016/j.jpba.2021.114350
Eke Rita, Ejiofor Emmanuel, Oyedemi Sunday, Onoja Samuel, Omeh Ndukaku. Evaluation of nutritional composition of Citrullus lanatus Linn. (watermelon) seed and biochemical assessment of the seed oil in rats. J Food Biochem. 2021;45(6):e13763. 10.1111/jfbc.13763
El-Demerdash Fatma M, El-Sayed Raghda A, Abdel-Daim Mohamed M. Rosmarinus officinalis essential oil modulates renal toxicity and oxidative stress induced by potassium dichro-mate in rats. J Trace Elem Med Biol. 2021;67:126791. 10.1016/j.jtemb.2021.126791
Esteki M, Shahsavari Z, Simal-Gandara J. Food identification by high performance liquid chromatography fingerprinting and mathematical processing. Food Res Int. 2019;122: 303–17. 10.1016/j.foodres.2019.04.025
Fernández-Pachón Ma Soledad, Villaño Débora, Troncoso Ana Ma, García-Parrilla Ma Carmen. [Review of the different methods for the evaluation of the in vitro antioxidant activity of wine and study of in vivo effects]. Arch Latinoam Nutr. 2006;56(2):110–22.
Food and Drug Administration. Botanical Drug Development Guidance for Industry, https://www.fda.gov/media/93113/; 2016 [Accessed
Gao Yuye, Yu Xie-An, Wang Bing, Yin Guo, Wang Jue, Wang Tiejie, et al. Based on multi-activity integrated strategy to screening, characterization and quantification of bioactive compounds from red wine. Molecules. 2021;26(21);6750. 10.3390/molecules26216750
Haunschild Robin, Marx Werner. 2022. On health effects of resveratrol in wine. Int J Environ Res Public Health. 2022;19(5):3110. 10.3390/ijerph19053110
Huang Yin, Tian Yuan, Zhang Zunjian, Peng Can. A HILIC-MS/ MS method for the simultaneous determination of seven organic acids in rat urine as biomarkers of exposure to realgar. J Chromatogr B Analyt Technol Biomed Life Sci. 2012;905:37–42. 10.1016/j.jchromb.2012.07.038
Kong Chang-Suk, Kim Jung-Ae, Qian Zhong-Ji, Kim You Ah, Lee Jung Im., Kim Se-Kwon, et al. Protective effect of isorhamnetin 3-O-beta-D-glucopyranoside from Salicornia herbacea against oxidation-induced cell damage. Food Chem Toxicol. 2009;47(8):1914–20. 10.1016/j.fct.2009.05.002
Lavigne Elodie Gras, Cavagnino Andrea, Steinschneider Rémy, Breton Lionel, Baraibar Martin A, Jäger Sibylle. 2022. Oxidative damage prevention in human skin and sensory neurons by a salicylic acid derivative. Free Radic Biol Med. 2022;181:98–104. 10.1016/j.freeradbiomed.2022.01.029
Ma Fengwei, Gong Xiaojian, Zhou Xin, Zhao Yang, Li Menglin. An UHPLC-MS/MS method for simultaneous quantification of gallic acid and protocatechuic acid in rat plasma after oral administration of Polygonum capitatum extract and its application to pharmacokinetics. J Ethnopharmacol. 2015;162:377–83. 10.1016/j.jep.2014.12.044
Manjunatha S, Shaik Althaf Hussain, Maruthi Prasad E, Al Omar Suliman Yousef, Mohammad Altaf, Kodidhela Lakshmi Devi. Combined cardio-protective ability of syringic acid and resveratrol against isoproterenol induced cardio-toxicity in rats via attenuating NF-kB and TNF-α pathways. Sci Rep. 2020;10(1):3426. 10.1038/s41598-020-59925-0
Navajas-Porras Beatriz, Pérez-Burillo Sergio, Valverde-Moya Álvaro Jesús, Hinojosa-Nogueira Daniel, Pastoriza Silvia, Rufián-Henares José Ángel. Effect of cooking methods on the antioxidant capacity of plant foods submitted to in vitro digestion-fermentation. Antioxidants (Basel). 2020;9(12):1312. 10.3390/antiox9121312
Plumb Jenny, Durazzo Alessandra, Lucarini Massimo, Camilli Emanuela, Turrini Aida, Marletta Luisa, et al. Extractable and nonextractable antioxidants composition in the eBASIS database: A key tool for dietary assessment in human health and disease research. Nutrients. 2020;12(11):3405. 10.3390/nu12113405
Rao Si-Wei, Duan Yuan-Yuan, Pang Han-Qing, Xu Shao-Hua, Hu Shou-Qian, Cheng Ke-Guang, et al. Spectrum-effect relationship analysis of bioactive compounds in Zanthoxylum nitidum (Roxb.) DC by ultra-high performance liquid chromatography mass spectrometry coupled with comprehensive filtering approaches. Front Pharmacol. 2022;13:794277. 10.3389/fphar.2022.794277
Sohrabi Farzaneh, Dianat Mahin, Badavi Mohammad, Radan Maryam, Mard Seyyed Ali. Gallic acid suppresses inflammation and oxidative stress through modulating Nrf2-HO-1-NF-κB signaling pathways in elastase-induced emphysema in rats. Environ Sci Pollut Res Int. 2021;28(40):56822–34. 10.1007/s11356-021-14513-1
Somade Oluwatobi T, Adeyi Olubisi E, Ajayi Babajide O, Asunde Osiro O, Iloh Precious D, Adesanya Adedayo A, et al. Syringic and ascorbic acids prevent NDMA-induced pulmonary fibro-genesis, inflammation, apoptosis, and oxidative stress through the regulation of PI3K-Akt/PKB-mTOR-PTEN signaling pathway. Metabol Open. 2022;14:100179. 10.1016/j.metop.2022.100179
Spagnol Caroline Magnani, Assis Renata Pires, Brunetti Iguatemy Lourenço, Isaac Vera Lucia Borges, Salgado Hérida Regina Nunes, Corrêa Marcos Antonio. In vitro methods to determine the antioxidant activity of caffeic acid. Spectrochim Acta A Mol Biomol Spectrosc. 2019;219:358–66. 10.1016/j.saa.2019.04.025
Svoboda Pavel, Vlčková Hana, Nováková Lucie. Development and validation of UHPLC-MS/MS method for determination of eight naturally occurring catechin derivatives in various tea samples and the role of matrix effects. J Pharm Biomed Anal. 2015;114:62–70. 10.1016/j.jpba.2015.04.026
Tkacz Karolina, Wojdyło Aneta, Turkiewicz Igor P, Ferreres Federico, Moreno Diego A, Nowicka Paulina. UPLC-PDA-Q/ TOF-MS profiling of phenolic and carotenoid compounds and their influence on anticholinergic potential for AChE and BuChE inhibition and on-line antioxidant activity of selected Hippophaë rhamnoides L. cultivars. Food Chem. 2020;309:125766. 10.1016/j.foodchem.2019.125766
Wang Yanan, Wu Haoshuang, Zhou Zhongyi, Maitz Manfred F, Liu Kunpeng, Zhang Bo, et al. A thrombin-triggered self-regulating anticoagulant strategy combined with anti-inflammatory capacity for blood-contacting implants. Sci Adv. 2022;8(9):eabm3378. 10.1126/sciadv.abm3378
World Health Organization. Program on traditional medicine. Guidelines for the assessment of herbal medicines. World Health Organization, https://apps.who.int/iris/handle/10665/58865; 1991 [Accessed
Xu Nan, Li Mingchen, Wang Ping, Wang Shuling, Shi Haiyan. Spectrum-effect relationship between antioxidant and anti-inflammatory effects of Banxia Baizhu Tianma decoction: An identification method of active substances with endothelial cell protective effect. Front Pharmacol. 2022;13:823341. 10.3389/fphar.2022.823341
Yan Linlin, Yin Peipei, Ma Chao, Liu Yujun. Method development and validation for pharmacokinetic and tissue distributions of ellagic acid using ultrahigh performance liquid chromatography-tandem mass spectrometry (UPLC-MS/MS). Molecules. 2014;19(11):18923–35. 10.3390/molecules191118923
Yang Lanping, Xie Xiuman, Zhang Jing, Sun Guoxiang. Microemulsion electrokinetic chromatography in combination with chemometric methods to evaluate the holistic quality consistency and predict the antioxidant activity of Ixeris sonchifolia (Bunge) Hance injection. PLoS One. 2016;11(6):e0157601. 10.1371/journal.pone.0157601
Zarubina IV, Lukk MV, Shabanov PD. Antihypoxic and antioxidant effects of exogenous succinic acid and aminothiol succinate-containing antihypoxants. Bull Exp Biol Med. 2012;153(3):336–9. 10.1007/s10517-012-1709-5
Zhang Xian-Fei, Chen Juan, Yang Jun-Li, Shi Yan-Ping. UPLC-MS/MS analysis for antioxidant components of Lycii fructus based on spectrum-effect relationship. Talanta. 2018;180:389–95. 10.1016/j.talanta.2017.12.078
Zhang Xiangyu, Wang Shilan, Wu Yujun, Liu Xiaoyi, Wang Junjun, Han Dandan. Ellagic acid alleviates diquat-induced jejunum oxidative stress in C57BL/6 mice through activating Nrf2 mediated signaling pathway. Nutrients. 2022;14(5):1103. 10.3390/nu14051103
Zhao Yun, Fang Chanlin, Jin Cuiyuan, Bao Zhiwei, Yang Guiling, Jin Yuanxiang. Catechin from green tea had the potential to decrease the chlorpyrifos induced oxidative stress in larval zebrafish (Danio rerio). Pestic Biochem Physiol. 2022;182:105028. 10.1016/j.pestbp.2021.105028