
Download

RESEARCH ARTICLE
Effects of fat meat and storage temperature on the qualities of frozen minced beef products
H.S. Lee1, Y.I. Park1*, S.H. Kang2*
1Department of Biotechnology, The Catholic University of Korea, Bucheon, Republic of Korea;
2Department of Forensic Medicine, Seoul National University, Seoul, Republic of Korea.
Abstract
The purpose of this study was to identify the ideal storage period for frozen minced beef products and to understand key factors affecting their quality. Frozen minced beef products with 10 and 15% of fat content were kept at −5, −15, and −23°C, and over a 6-month period, they were assessed for moisture content (MC), peroxide values (POV), acid values (AV), 2-thiobarbituric acid (TBA) value, total volatile basic nitrogen content (TVB-N), and the sensory test in order to identify the effect on quality. This helped to determine their appropriate storage duration at a given temperature. Multiple regression analysis was used to assess the correlations between storage temperature, fat meat percentage, characteristic factors, and overall acceptance (OA). Five months for −23°C, 4 months for −15°C, and 2 months for −5°C met 3.7 points or more of OA, in accordance with global sensory analysis standards, and were determined as acceptable frozen storage durations. The very high multiple regression analysis R2 (0.97–0.99) verified the correlation between the characteristic factors and OA. In addition, TVB-N, MC, and POV, respectively, were the main quality factors affecting OA at −5, −15, and −23°C (R2 > 0.8). These findings may prove useful and practical for manufacturers to improve storage and distribution practices in maintaining the quality of frozen minced beef products.
Key words: shelf life, frozen cooked, beef fat
*Corresponding authors: Yong Il Park, Department of Biotechnology, The Catholic University of Korea, Bucheon, Gyeonggi-do 14662, Republic of Korea. Email: [email protected]
Sae hoon Kang, Department of Forensic Medicine, Seoul National University, Seoul 08826, Republic of Korea. Email: [email protected]
Submitted: 27 September 2020; Accepted: 29 November 2020; Published: 9 February 2021.
© 2021 Codon Publications
This is an Open Access article distributed under the terms of the Creative Commons Attribution-NonCommercial-ShareAlike 4.0 International (CC BY-NC-SA 4.0). License (http://creativecommons.org/licenses/by-nc-sa/4.0/)
Introduction
Consumption of minced meat is very high in South Korea. A 2018 study found that roughly 4% of all consumer meat products were minced, most of which were frozen to prolong their shelf lives (MFDS, 2018a). Normally, frozen meat product expiry dates are set by microbiological or chemical hazard analysis test results, assuming storage to be at −18°C. However, in addition, major food manufacturers choose best before dates considering consumer preferences and practical distribution environments. While South Korean food laws regulate that frozen meat products be stored at or below −18°C to impede microbic growth, manufacturers determine shelf lives based on storage temperatures of −18°C (MFDS, 2018b). Despite this, below 30% of grocery stores store frozen meat products at or below −18°C (Choi et al., 2011). Furthermore, due to cycles of freezing and thawing from temperature changes, degradation in quality, such as meat drips, protein deterioration, and fat oxidation, still occurs (Grujic et al., 1993). Thus, temperature regulation is crucial. Traditionally, microorganisms potentially harmful to public health have been the main concern in the evaluation of quality. Lipid oxidation is another key cause of quality degradation in meat products resulting in off-flavors caused by breakdown of products (Monica et al., 2016). Thus, several papers suggest that MC, POV, AV, TVB-N, and TBA values may govern changes in meat quality. Wannee and Fredrick (2017) found that TBA value and TVB-N content increases as refrigeration temperature rises, and MC reduces at higher temperatures and longer storage durations. These findings are verified and expanded by Marian et al. (2018) who noted increasing TBA values and TVB-N content in frozen meat products correlated with longer frozen storage. POV is another common identifier of meat quality, as it can help determine early stage lipid oxidation (Gunstone and Norris, 1983). Jeong et al. (1991) observed lower POV and AV at lower temperatures in frozen dumplings. TVB-N content as a quality factor is already officially recognized. Korean food laws mandate that TVB-N content doesn’t surpass 20.0 mg% in all freshly packaged meats (MFDS, 2018b), though this doesn’t apply to frozen minced meat products. While chemical tests are the primary determinant of meat quality in most studies and regulations, sensory tests are important to satisfy consumers (Niana et al., 2017). Consumers complain about food quality despite its chemically admissible levels (Lee et al., 2001). Thus, the relationship between chemical and sensory tests needs to be examined.
In addition, South Korean consumers prefer 10–15% fat meat content minced beef products for health reasons, despite findings that >20% fat meat ground beef are juicier and more tender (Anderson and Berry, 2001). It has been assumed that high-fat content minced beef products produce more POV and TBA, among other oxides, which substantially influence quality. Until now, no studies have evaluated the degree to which frozen minced beef product quality is impacted by storage temperature and fat meat content. Thus, this study examined this relationship over various storage durations. In addition, practical storage temperatures and periods were determined with the aid of sensory tests. Multiple regression analysis was utilized to see if these results correlate with quality factors.
Materials and Methods
Sample preparation
The best frozen minced beef products were identified by their popularity, and two types were secured from a local supplier. The obtained patties were formulated to reach fat meat levels of 10 and 15% from a combination of beef fat meat and lean trimmings, and had 15 seasonings, 10 sauces, and 5% water. Both the fat and lean meat were minced using a high-speed grinder (Koppens F-202, Netherland), chopped by machine (Koppens Weiier890, Netherland), blended in a mixer (Koppens VM600HD, Netherland) for 3 min, and processed into 88–92 g beef products. The samples were then cooked in the oven at 230°C, then frozen at −35°C for 10 min using a rapid freezer (North Field, American). For 24 h, temperature fluctuations in the refrigerators were recorded with a food Tracker (Datapaq Inc, England).
Color evaluation
Lightness (L*-value), redness (a*-value), and yellowness (b*-value) of the samples were evaluated using a colorimeter (Chroma meter CR-301, Minolta Corporation, Ramsey, NJ, USA). The standard colors, L* = 89.22, a* = 0.91, and b* = 0.79, of the calibration plate were measured once a month to maintain a fixed standard.
Microbial testing
Two hundred and twenty-five milliliters of sterile saline solution (0.85%) and 25 g of each patty sample were homogenized in a Stomacher blender bag for 1 min and serially diluted to enumerate Escherichia coli and E. coli O157:H7. A 0.5 mL aliquot-part of each diluent was surface-plated on plate count agar for a total plate count, which was incubated at 34–36°C for 1–2 days. The colonies were tallied, and the findings are expressed as colony-forming units (log CFU/g). One milliliter of diluent was deposited in duplicate on 3M Petrifilm™ E. coli Count Plates (3M Health Care, St. Paul, MN, USA), incubated at 37°C for 1–2 days, and the colonies were tallied. Red colonies with associated gas bubbles were tallied as probable E. coli 0157:H7 and were verified as hemorrhagic E. coli 0157:H7 with the 3M Petrifilm™ Test Kit-HEC. This was then measured once a month.
Moisture content
Moisture content in each sample was determined, once a month, by oven-drying at 105°C (MFDS, 2018b).
Lipid oxidation
The POV and acid value (AV), and 2-thiobarbituric acid (TBA) values were measured using the Korean Food Standards method (MFDS, 2018b). One milliliter of KI solution and 24 mL of a solvent mixture (chloroform: glacial acetate = 2:3 v/v) were added to 3 g of sample in order to determine peroxide values (POV) and then shook for another 5 min. After 75 mL of distilled water was added into the laboratory tubes, the mixture was shaken again for 3 min. Starch solution was added to the mixture, and the mixture was titrated with 0.01 N sodium thiosulfate. A piece of fat tissue from the sample (10 g) was used in order to determine the AV. After a couple of drops of 1% phenolphthalein was added to the solution, the mixture was titrated with 0.1 N KOH-ethanol. The endpoint was determined as the point at which the color of the mixture turned to a dark pink color. For measurement of the TBA value, 5 g of sample with 50 mL of solution that contained 20% trichloroacetic acid in 2 M phosphoric acid was homogenized for 2 min in a homogenizer (AM-7, Nissei Co., Tokyo, Japan). The ensuing slurry was diluted with 100 mL of distilled water and was homogenized. After solid particles were removed from the liquid with a filter medium, 5 mL of filtrate was mixed with another 5 mL of TBA (0.005 M in distilled water), and the mixture was stored in the dark for 15 h at 15–25°C. The final color was determined spectrophotometrically at 530 nm.
Protein deterioration
Protein deterioration was assessed utilizing the Conway method and the Korean Food Standards method (MFDS, 2018b). After 20 g of the sample with distilled water was homogenized, the total volume was adjusted to 100 mL using a mess flask. The homogenate was placed in 80°C water-bath for 30 min to extract ammonia. One milliliter of the filtrate was applied on the outer part of the Conway chamber, and then 1 mL of H2SO4 (0.01 N) was applied in the inner part. Another 1 mL of saturated solution (K2CO3) was added on the lower layer of the outer part. The chamber was immediately sealed and incubated at 15–25°C for 2 h. Finally, a drop of Brunswick indicator with NaOH (0.01 N) was added to the solution until the color changed from red to green. The experiment was repeated twice, and the average value was determined.
Sensory test
With a dedicated panel, QDA (Quantitative Descriptive Analysis) was conducted for the sensory test of samples (Moskowitz, 1988). Sensory test on frozen minced beef products was conducted by assigning 11 trained panelists who passed the exam for the sensory test by scoring 90% or more once a month for 6 months (Meilgaard et al., 2015). Five characteristics were evaluated: appearance, flavor, tenderness, juiciness, and overall acceptance. The score for each characteristic is 1–5.
Statistical analysis
The data were analyzed using the Duncan’s multiple range test method, and linear regression and multiple regression analyses methods (P < 0.05) in Statistical Analysis System (SAS) program 10.1 (SAS Institute., Cary, NC, USA).
Results and Discussion
Freezer temperatures set to −5, −15, and −23°C are really scoped from −3.4 to −6.9, −13.5 to −16.7, and −21.9 to −24.3°C, respectively, (Table A1).
Table A1. Temperature fluctuations in freezers set at −5, −15, and −23°C during 24 h of frozen storage.
| Temperature | −5oC | −15oC | −23oC |
|---|---|---|---|
| Maximum | −7oC | −16.7oC | −24.4oC |
| Minimum | −3.4oC | −13.5oC | −22oC |
Color changes
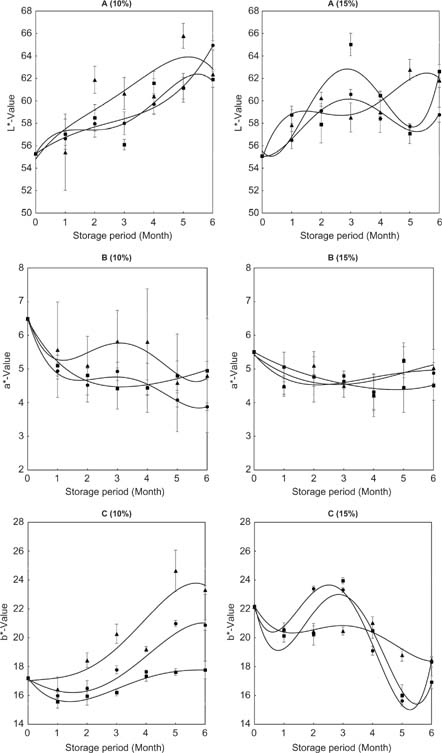
Meat product color, being a marker of quality, is a major determinant affecting consumers’ purchasing decisions (Hong et al., 2003). It is well-known that during storage, the color of meat products alters. Such changes are commonly caused by pigment oxidation, for example, myoglobin and oxy-myoglobin producing met-myoglobin (Utrera et al., 2014a). Ice crystallization during frozen storage accelerates this process of oxidation (Zaritzky, 2012). As a result of evaluating the color changes of frozen minced beef products during frozen storage, lightness (L*-value) was increased, and redness (a*-value) and yellowness (b*-value) of the samples were decreased at the 6th month of storage (Figure A1 [A2, B1, and C1]). Comparable findings were observed in the previous study of Song et al. (2011), which showed that L*-value was increased, a*-value was decreased, and b*-value was not changed during frozen storage of hamburger patties. Utrera et al. (2014a) reported that high-fat content patties had more intense color changes than medium-fat content patties, and the color changes were more intense as the temperature of frozen storage was increased (Utrera et al., 2014b). However, storage temperature and fat contents had no effects on changes of those color values in this study.
Figure A1. Changes in L*-value (A), a*-value (B), b*-value (C) of samples containing 10 and 15% fat meat during the frozen storage period [−5 (•), −15 (▲), and −23°C (◼)].
Changes in microbiological level
As shown in Table 1, total starting plate counts for frozen minced beef products were 3.7 log CFU/g for the 10% samples and 3.7 log CFU/g for the 15% samples. In both patty groups, E. coli or E. coli O157:H7 was detected. The South Korean government stipulates that E. coli should be detected below a certain level in frozen meat to be hygienic. The South Korean government stipulates that E. coli should be detected below the level of 6.4 log CFU/g in frozen meat, and E. coli O157:H7 should be undetectable, making it hygienically safe (MFDS, 2018b). Therefore, the study samples used met this standard. For both 10 and 15% samples, in frozen storage at temperatures of −5, −15, and −23°C for over a period of 6 months, the total plate counts stayed constant. These findings indicate that frozen minced beef products kept at −5°C or below would remain microbiologically safe for a period of 6 months. Studies by Goepfert (1977) observed higher total plate counts and the presence of E. coli in general beef burger patties. Goepfert (1977) also noted aero plate counts of 5.0–6.1 log CFU/g on a total of 604 frozen beef patties and presumed that the aero plate count of a product decreased in the freezing process during frozen storage. In addition, Goepfert (1977) reported that in 8.5% of the samples, an E. coli count of 3.0 log CFU/g was exceeded. Long-term storage beyond 6 months at −5°C led to E. coli O157:H7 and E. coli growth in the 10% samples. These findings indicate that frozen minced beef products kept at −5, −15, and −23°C maintain their microbiological safety for a period of 6 months in frozen storage.
Table 1. Changes in total plate Escherichia coli and E. coli O157:H7 of samples on the frozen storage period.
| Sample | Temp. (oC) |
Items | Storage period (month) (log cfu/g) | |||||||||
|---|---|---|---|---|---|---|---|---|---|---|---|---|
| 0 | 1 | 2 | 3 | 4 | 5 | 6 | 7 | 8 | 9 | |||
| Fat meat 10% |
−23 | Total plate count | 3.6 | 3.3 | 3.8 | 3.2 | 3.9 | 3.8 | 3.9 | 4.0 | 3.7 | 3.7 |
| Escherichia coli | – | – | – | – | – | – | – | – | – | |||
| E. coli O157:H7 | – | – | – | – | – | – | – | – | – | |||
| −15 | Total plate count | 3.6 | 3.8 | 3.2 | 3.8 | 3.6 | 3.9 | 3.8 | 3.7 | 3.8 | 3.8 | |
| Escherichia coli | – | – | – | – | – | – | – | – | – | – | ||
| E. coli O157:H7 | – | – | – | – | – | – | – | – | – | – | ||
| −5 | Total plate count | 3.6 | 3.8 | 3.6 | 3.7 | 3.7 | 3.9 | 3.5 | 3.7 | 3.5 | 4.1 | |
| Escherichia coli | – | – | – | – | – | – | – | +2) | + | + | ||
| E. coli O157:H7 | – | – | – | – | – | – | – | – | – | + | ||
| Fat meat 15% |
−23 | Total plate count | 2.7 | 3.7 | 3.3 | 3.6 | 3.3 | 3.8 | 3.6 | 3.8 | 3.7 | 2.0 |
| Escherichia coli | – | – | – | – | – | – | – | – | – | – | ||
| E. coli O157:H7 | – | – | – | – | – | – | – | – | – | – | ||
| −15 | Total Plate count | 3.7 | 2.0 | 2.4 | 3.8 | 3.5 | 2.4 | 3.5 | 3.8 | 3.2 | 3.4 | |
| Escherichia coli | – | – | – | – | – | – | – | – | – | – | ||
| E. coli O157:H7 | – | – | – | – | – | – | – | – | – | – | ||
| −5 | Total plate count | 3.7 | 3.6 | 3.5 | 3.7 | 2.3 | 3.6 | 3.7 | 3.9 | 3.8 | 4.9 | |
| Escherichia coli | – | – | – | – | – | – | – | – | – | – | ||
| E. coli O157:H7 | – | – | – | – | – | – | – | – | – | – | ||
1)Negative.
2)Positive.
Changes in moisture content
Since moisture allows chemical reactions to occur, it affects food quality, texture, and lipid oxidation. Thus, monitoring MC changes to ensure quality during storage is vital (Gray et al., 1996). MC immediately after production in 10 and 15% samples were 46.32 and 46.66%, respectively,; these MC reduced to 41.23, 43.01, and 43.28% (10% samples), and 40.11, 42.99, and 43.11% (15% samples), after 6 months at −5, −15, and −23°C, respectively, (Table 2). While this reduction in both 10 and 15% samples kept at −23°C was insignificant (P < 0.05), MC changes were significant (P < 0.05) in both patty types kept at −5°C after 2 months and −15°C after 3 months. The larger MC reduction in samples kept at −5 and −15°C was likely the result of nonfrozen water evaporating. This is consistent with the results of Park et al. (1998). Thus, lower temperatures are recommended to limit moisture loss. There have also been some attempts to minimize moisture loss in beef patties while in refrigerated storage. In addition, Dharmaveer et al. (2007) found that an HDPE-packaged goat meat patty retained its MC for 25 days of refrigerated storage.
Table 2. Changes in MC, AV, POV, TBA, and TVB-N of samples on the frozen storage period.
| Sample | Items | Temp.(oC) | Storage period (month) | ||||||
|---|---|---|---|---|---|---|---|---|---|
| 0 | 1 | 2 | 3 | 4 | 5 | 6 | |||
| Fat meat 10% |
MC (%) | −23 | 46.32 | 45.11 ± 0.49Aa1) | 45.06 ± 0.51Aa | 44.46 ± 2.17Bab | 43.99 ± 0.32Ba | 43.55 ± 0.10Ba | 43.28 ± 0.55Ba |
| −15 | 45.09 ± 0.37Aab | 44.99 ± 0.25Aab | 44.08 ± 0.42Bab | 43.06 ± 0.51Cbc | 43.01 ± 0.13Cab | 43.01 ± 0.09Bb | |||
| −5 | 44.35 ± 0.30Abc | 43.06 ± 0.47Ac | 42.95 ± 0.43Bbc | 42.35 ± 0.31Cbc | 41.56 ± 0.77Cc | 41.23 ± 0.40Cc | |||
| AV (KOH/g) |
−23 | 1.02 | 1.20 ± 0.04Aa | 1.35 ± 0.21Aa | 1.39 ± 0.10Aa | 1.43 ± 0.06Aa | 1.55 ± 0.07Ba | 1.56 ± 0.04Ba | |
| −15 | 1.68 ± 0.05Abc | 1.85 ± 0.07ABbc | 2.01 ± 0.12Bbc | 2.06 ± 0.18Bbc | 2.08 ± 0.03Bbc | 2.09 ± 0.05Bbc | |||
| −5 | 1.84 ± 0.07Ac | 1.93 ± 0.16ABbc | 2.24 ± 0.09BCc | 2.35 ± 0.14Cbc | 2.36 ± 0.09Cc | 2.37 ± 0.03Cc | |||
| POV (meq/kg) |
−23 | 2.16 | 2.54 ± 0.02Aa | 2.66 ± 0.14ABa | 2.74 ± 0.02BCa | 2.95 ± 0.21BCa | 2.98 ± 0.19Ca | 3.01 ± 0.06Ca | |
| −15 | 3.14 ± 0.22Ab | 3.64 ± 0.28ABb | 3.78 ± 0.21ABb | 4.18 ± 0.11BCb | 4.25 ± 0.23CDb | 4.33 ± 0.31Db | |||
| −5 | 3.85 ± 0.13Ac | 3.92 ± 0.06Bbc | 4.29 ± 0.11Cc | 4.96 ± 0.22Dc | 5.50 ± 0.12Ec | 6.14 ± 0.07Fc | |||
| TBA (mg/kg) |
−23 | 0.32 | 0.51 ± 0.14Aa | 0.56 ± 0.03ABa | 0.62 ± 0.19ABCa | 0.65 ± 0.11BCa | 0.71 ± 0.07BCab | 0.62 ± 0.09ABCab | |
| −15 | 0.56 ± 0.09Aa | 0.68 ± 0.06ABb | 0.72 ± 0.08ABb | 0.88 ± 0.10BCb | 0.97 ± 0.20BCDabc | 0.91 ± 0.13BCb | |||
| −5 | 0.79 ± 0.11Aab | 0.89 ± 0.11ABc | 0.96 ± 0.12ABbc | 1.06 ± 0.04BCc | 1.12 ± 0.12Cbc | 0.99 ± 0.18ABCbc | |||
| TVB-N (mg%) |
−23 | 1.56 | 6.28 ± 0.16Aa | 6.94 ± 0.33ABa | 8.69 ± 0.25Ca | 9.93 ± 0.23Da | 10.05 ± 0.42DEa | 10.33 ± 0.31DEFa | |
| −15 | 6.94 ± 0.33Ab | 7.25 ± 0.42Bab | 9.67 ± 0.37Cb | 9.94 ± 0.44Cab | 10.58 ± 0.46Db | 11.48 ± 0.65DEb | |||
| −5 | 7.34 ± 0.21Abc | 10.58 ± 0.77Bc | 11.05 ± 0.53Cc | 11.55 ± 0.52Cc | 11.88 ± 0.22CDc | 12.01 ± 0.38DEbc | |||
| Fat meat 15% |
MC (%) |
−23 | 46.66 | 45.02 ± 0.46Aa | 44.99 ± 0.07Aa | 44.58 ± 0.42ABa | 43.96 ± 0.18BCa | 43.51 ± 0.31BCa | 43.11 ± 0.16Da |
| −15 | 44.51 ± 0.63Ab | 44.22 ± 0.21ABb | 44.02 ± 0.04ABb | 43.56 ± 0.20BCab | 43.03 ± 0.30BCab | 42.99 ± 0.22Da | |||
| −5 | 44.00 ± 0.45Ac | 43.54 ± 0.57ABbc | 42.09 ± 0.21ABc | 41.01 ± 0.14Cc | 40.51 ± 0.07Cc | 40.11 ± 0.22Cb | |||
| AV (KOH/g) |
−23 | 1.34 | 1.67 ± 0.04Aab | 1.74 ± 0.17Aa | 1.79 ± 0.03Aa | 1.81 ± 0.09Aa | 1.84 ± 0.11Aa | 1.91 ± 0.13Ba | |
| −15 | 1.74 ± 0.05Aab | 1.92 ± 0.10Ab | 2.05 ± 0.06Bb | 2.16 ± 0.03Bbc | 2.19 ± 0.12BCbc | 2.21 ± 0.25Bbc | |||
| −5 | 1.79 ± 0.04Aab | 1.96 ± 0.06Abc | 2.16 ± 0.15Bbc | 2.19 ± 0.11Bbc | 2.20 ± 0.37BCbc | 2.23 ± 0.14Bbc | |||
| POV (meq/kg) |
−23 | 2.49 | 2.74 ± 0.09Aa | 2.81 ± 0.08Aa | 2.88 ± 0.06Aa | 2.91 ± 0.13ABa | 2.95 ± 0.18Ba | 3.12 ± 0.11Ba | |
| −15 | 3.34 ± 0.08Ab | 3.84 ± 0.11ABbc | 3.92 ± 0.21BCb | 4.17 ± 0.11CDb | 4.38 ± 0.09DEb | 4.44 ± 0.06DEb | |||
| −5 | 4.01 ± 0.32Ac | 4.96 ± 0.48Ac | 5.20 ± 0.05Ac | 5.52 ± 0.28Bc | 6.58 ± 0.28Cc | 6.99 ± 0.02Dc | |||
| TBA (mg/kg) |
−23 | 0.37 | 0.68 ± 0.06Aab | 0.74 ± 0.05ABab | 0.78 ± 0.07ABa | 0.81 ± 0.10Ba | 0.82 ± 0.17Bab | 0.82 ± 0.06Ba | |
| −15 | 0.71 ± 0.05Aab | 0.89 ± 0.14Abc | 0.91 ± 0.06Bbc | 0.99 ± 0.06Bb | 1.06 ± 0.08Cab | 1.01 ± 0.16Cb | |||
| −5 | 0.83 ± 0.06Ac | 0.95 ± 0.08ABbc | 1.08 ± 0.05ABbc | 1.09 ± 0.20Cc | 1.14 ± 0.05Cab | 1.04 ± 0.12Cb | |||
| TVB-N (mg%) |
−23 | 1.55 | 6.82 ± 0.17Aa | 6.96 ± 0.22Aa | 8.96 ± 0.34Ba | 9.98 ± 0.31BCa | 10.11 ± 0.71CDa | 10.53 ± 0.65DFa | |
| −15 | 7.06 ± 0.13Aab | 7.39 ± 0.08Bb | 10.05 ± 0.30BCb | 10.54 ± 0.02BCb | 11.05 ± 0.87Cab | 11.58 ± 0.29Db | |||
| −5 | 7.48 ± 0.17Ac | 10.66 ± 0.47Bc | 11.69 ± 0.06Cc | 12.02 ± 0.25CDc | 12.26 ± 0.44Dbc | 12.99 ± 0.74Ec | |||
A–F values with different superscripts in the same row differ significantly (P < 0.05).
a–c values with different superscripts in the same column differ significantly (P < 0.05).
1Mean (n = 3) ± SD.
Changes in lipid oxidation
Oxidation and lipid hydrolysis happen continuously in all meat products, affecting its flavor (Gray et al., 1996). Microorganisms and hydrolytic enzymes cause oxidation and lipid hydrolysis, which are affected by fat content, storage temperature, and storage duration (Cai et al., 2020). Thus, AV, TBA, and POV of the patty samples were measured to identify what effect storage temperature and fat meat content had on lipid oxidation in frozen minced beef products.
Table 2 shows the AV changes in the 10 and 15% samples over a period 6 months at −5, −15, and −23°C. The AV of 10 and 15% samples were 1.02 and 1.34 mg KOH/g fat, respectively, before storage; however, they increased to 2.37, 2.09, and 1.56 mg KOH/g fat, and 2.23, 2.21, and 1.91 mg KOH/g fat after 6 months at −5, −15, and −23°C, comparatively. There were no significant (P < 0.05) AV increases in either type of patty when kept at −23°C over 6 months; however, after only 3 months, marked AV increases (P < 0.05) in the patties kept at −5 and −15°C were found, especially significantly in the 15% samples kept at −5°C (P < 0.05). In addition, after only 1 month, the AV increases in patties kept at −5 and −15°C were markedly elevated (P < 0.05). This suggests that patties kept at −23°C would have had lower unfrozen MC and chemical reactants, and consequently lower hydrolytic rancidity (Lee, 1995). Elevated AV in 15% samples was the result of greater quantities of fat being hydrolyzed creating increased fatty acids. The AV of the samples kept at −5 and −15°C did not change after 3 months. Ozer and Saricoban (2010) observed small pH increase in chicken patties while in frozen storage and asserted that such pH increases were the result of the build-up of metabolites due to deamination of proteins and bacterial action.
POV changes in 10 and 15% samples at −5, −15, and −23°C for 6 months are shown in Table 2, respectively. When storage commenced, POV of the 10% samples was 2.16, whereas for 15% samples, it was 2.49 meq/kg. After a period of 6 months at −5, −15, and −23°C, however, POV increased in the 10% samples to 6.14, 4.33, and 3.01 meq/kg, and the 15% samples to 6.99, 4.44, and 3.12 meq/kg, respectively. The greater POV at the start of the experiment in the 15 than 10% samples was due to greater fat content. While Keeton (1983) found that fat content had no noticeable effect on TBA or POV of 20−30% fat beef patties, our 10 and 15% samples showed notable increases in POV after 3 and 5 months at −23°C, respectively. Both 10 and 15% samples kept at −15°C registered notable POV increases over 4 and 3 months, respectively, while those kept at −5°C registered notable increases over 4 and 2 months, respectively. Notable POV increases were identified in both patty types at all storage temperatures from month one and continued to increase with storage period and temperatures. POV increases did not noticeably vary between 10 and 15% samples, except when kept at −5°C, despite the 15% samples starting with higher POV. These findings suggest higher frozen storage temperatures hastened fat oxidation, which other studies corroborate (Jeong et al., 1991; Mariana et al., 2014).
TBA value changes in both 10 and 15% samples stored for 6 months at −5, −15, and −23°C, respectively, are shown in Table 2. TBA values of the 10% samples were 0.32 and the 15% samples were 0.37 mg/kg when storage began. These values increased to 1.12, 0.97, and 0.71 mg/kg for the 10% samples, and 1.14, 0.99, and 0.81 mg/kg for the 15% samples when kept at −5, −15, and −23°C for 5 and 4 months, respectively, later dropping to 0.99, 0.91, and 0.62 mg/kg, and 1.04, 1.01, and 0.82 mg/kg at the 6-month mark, respectively. Frozen minced beef products kept at −23°C for 5 months recorded the highest TBA values, compared with 5 months for the −5 and −15°C groups. Irrespective of the fat meat content, these values then reduced. Laleye et al. (1984) reported similar TBA value reductions after 4 or 5 months of frozen storage and found autoxidation of lipids during the early stages of frozen storage quickly produced, but this malondialdehyde reduced in later stages due to hydrolysis, slowed production, and bonding with carbonyls, amino acids, and urea, among other compounds.
Thus, studies found that TBA values reduced after early stages of frozen storage. Storage temperature did not affect TBA values as profoundly as it did to POV. To illustrate this, between the samples kept at −15 and −23°C, there was no marked difference (P < 0.05) in TBA values over the first 4 months. Beyond 4 months though, TBA values in patties kept at −5 and −15°C markedly increased (P < 0.05) compared to those kept at −23°C. This suggests that storage at −23°C suppressed autoxidation more effectively. These findings are consistent with a number of studies (Jeong et al., 1991; Yun et al., 1996).
Thus, meat product TBA values were widely used indicators of quality in numerous studies on the antioxidative effects of packaging (Limbo et al., 2010) and natural extracts (Lara et al., 2011). In contrast though, our study indicates that using TBA values to determine minced beef product quality is not propitious since it decreases after 4 to 5 months depending on storage temperature.
Changes in TVB-N content
TVB-N compounds found in beef products include ammonia, nucleotide derivatives, free amino acids, and amines, and due to enzymatic or bacterial degradation their levels increase as they begin to spoil. Therefore, TVB-N content is considered an important quality factor (Cai et al., 2011). The changes in TVB-N contents of 10 and 15% samples, kept at −5, −15, and −23°C over 6 months are presented in Table 2. Of the 10 and 15% samples, the starting TVB-N contents were 1.56 and 1.55 mg%, respectively. These increased, however, to 12.01, 11.48, and 10.33 mg% in the 10% samples, and to 12.99, 11.58, and 10.53 mg% in the 15% samples after being kept at −5, −15, and −23°C, respectively, for 6 months. Comparable TVB-N contents were found in a study by Akkose et al. (2008) in ground beef after being kept at −18°C over 6 months. However, the starting TVB-N content found by Lee et al. (2001) of 9.0 mg% was far greater than we observed. TVB-N content is regulated in South Korea below 20.0 mg% in fresh-cut meat; however, a study suggested that TVB-N content greater than 18.0 mg% in minced meat indicates potential putrefaction (Terasaki et al., 1965). In this study, though, all beef groups were measured to have TVB-N contents less than 18.0 mg%.
In the frozen minced beef products kept at −5 and −15°C, there was a marked increase (P < 0.05) in TVB-N contents after 1 month, and in the group kept at −23°C, TVB-N content saw a significant (P < 0.05) increase after 2 months. These results indicate that storage at lower temperatures more effectively slowed down protein deterioration. This is consistent with a study on frozen meatballs by Yun et al. (1996). In our study, lower unfrozen MC in the frozen minced beef products kept at lower temperatures was the likely cause of their lower TVB-N contents, as found by other published papers (Grujic et al., 1993; Park et al., 1998). As the storage duration increased, especially at higher temperatures, the 15% samples saw greater increases in TVB-N content than the 10% samples, likely as a result of the indirect effect oxidation and lipid hydrolysis had on protein deterioration (Park et al., 1998).
Changes in sensory characteristics
Figure 1 shows how sensory properties, like flavor, appearance, tenderness, juiciness and OA changed, in the 10 and 15% samples kept at −5, −15, and −23°C. Juiciness, tenderness, and OA saw the largest decreases at −5°C, while flavor and tenderness saw the largest decreases at −15 and −23°C over 6 months. For both 10 and 15% samples, the tenderness scores at the start of the experiment were 4.05 and 3.99, respectively, which is consistent with the findings of Keeton (1983). These tenderness scores for 10 and 15% samples kept at −15 and −23°C sharply reduced after 4 and 5 months, and degraded to 3.77 (10% samples) and 3.26 (15% samples), and 3.62 (10% samples) and 3.06 (15% samples), respectively, after 6 months.
Figure 1 Changes in sensory properties; appearance (A), flavor (F), juiciness (J), tenderness (T), and overall acceptance (OA) of samples containing 10 and 15% fat meat stored at various temperatures for 6 months. –•–, sensory score before storage; –⚪–, sensory score first month after storage; –◼–, sensory score second month after storage; –⚱–, sensory score third month after storage; –▲–, sensory score fourth month after storage; –△–, sensory score fifth month after storage; and –◆–, sensory score sixth month after storage.
In 15% samples stored at −15°C, the tenderness scores reduced more than in the 10% samples. During storage of 10 and 15% samples at −5°C, the tenderness scores degraded to 3.16 and 3.07, respectively, over 6 months, suggesting that storage temperature significantly affects tenderness. In the 10 and 15% samples, the juiciness scores at the start of the experiment were 4.01 and 3.97, respectively. This is again consistent with the results of Keeton (1983). In 10% samples, kept at −5, −15, and −23°C, juiciness scores quickly decreased after 6, 5, and 4 months, respectively, and reached 3.72, 3.57, and 3.08 after 6 months. In the 15% samples, the juiciness scores reduced to 3.70, 3.51, and 2.99, after 6 months. Higher storage temperatures and fat content negatively affected the juiciness of minced beef product. Patties stored at higher temperatures saw the most negative effects on flavor and appearance scores. In 10 and 15% samples stored at −23°C, the OA scores initially were 4.05 and 3.99, respectively; these degraded as the storage period increased, and after 6 months reached 3.71 and 3.70, respectively. These higher OA scores for high-fat patties and the subsequent OA reduction with increased storage periods are consistent with the findings of others (Keeton, 1983; Tobin et al., 2013).
In accordance with global sensory analysis standards, international meat processing companies must only sell products that score over 3.7 out of 5.0 on consumer preferences tests (ISO16779, 2015), which most major meat product manufacturing companies judge to be a good quality indicator. Since the scores of minced beef products kept at −23°C in our study stayed higher than this after 6 months, it indicates acceptability.
However, over 2 months, OA scores for the majority of 10 and 15% samples kept at −15°C deteriorated quickly to 3.89 and 3.77, and at −5°C to 3.26 and 3.11, respectively. Ten and 15% samples kept at −15°C retained an OA score of greater than 3.7 for 5 and 4 months, respectively, while OA values dropped below 3.7 over 2 months at −5°C. This suggests that acceptable storage durations to ensure beef patties meet quality standards reduced as fat meat content and temperature increased. Storage temperature more severely affected OA than fat content, consistent with the results of Jeong et al. (1991).
Table 3 describes the multiple regression results showing the correlation between numerous independent variables like TBA, POV, TVB-N, MC, and OA scores. This analysis supports the hypothesis that TBA, PO, TVB-N, and MC determine the OA of minced beef products with an R2 (coefficients of determination) of 0.97‒0.99.
Table 3. Correlations between OA (Y) and diverse independent variables, such as MC (X1), POV (X2), TVB-N (X3), and TBA value (X4) on the frozen storage period.
| Samples | Temp.(oC) | Regression equation | R2 |
|---|---|---|---|
| Fat meat 10% |
−5 | Y = 0.3605X1 − 0.1552X2 + 0.0616X3 + 1.0496X4 − 12.7383 | 0.97 |
| −15 | Y = −0.0149X1 − 0.2782X2 − 0.0182X3 − 0.0078X4 + 5.6416 | 0.99 | |
| −23 | Y = 0.0554X1 − 0.0918X2 − 0.0205X3 + 0.0024X4 + 1.1870 | 0.96 | |
| Fat meat 15% |
−5 | Y = −0.1898X1 − 0.6651X2 − 0.0935X3 + 0.6037X4 + 14.9273 | 0.99 |
| −15 | Y = −0.2451X1 − 0.8598X2 − 0.0206X3 + 0.7546X4 + 17.3424 | 0.99 | |
| −23 | Y = 0.0621 X1 + 0.0384X2 − 0.0333X3 − 0.4480X4 + 1.5714 | 0.99 |
The association between OA and the individual independent components was evaluated, and the coefficient of correlation (r) was contrasted in Table 4. The most influential factors on OA were different according to storage temperatures. MC plays a key role in minced beef products stored at −5 oC (r > 0.8), POV in samples stored at −15 oC, and TVB-N in samples stored at −23 oC (r > 0.9) over a period of 6 months. OA over long periods was reduced due to lipid oxidation and protein hydrolysis producing low molecular-weight compounds. OA of food products is also affected in combination by the selected variables, fatty acids, amino acids, acids, and peptides. Flavor and smell are affected by factors like organic acids, proteins, free amino acids, amines, and several nonvolatile compounds, in addition to small compounds like amino acids and low molecular peptides (Lee et al., 2001). Food texture is heavily influenced by MC, as are shelf life and quality, resulting from chemical reactions (Ramalingam et al., 2019). At higher temperatures, juiciness and tenderness were likely reduced due to unfrozen moisture evaporating. And TBA value has regularly been utilized as a measure of quality in other studies (Dharmaveer et al., 2007; Lara et al., 2011).
Table 4. Regression equation for OA prediction on the frozen storage period.
| Temp. (oC) | Measurement | Regression equation | Coefficient of correlation (r) | X factor |
|---|---|---|---|---|
| −5 | OA | Y = −0.0639X + 4.3725 | 0.9091 | TVB-N |
| −15 | Y = −0.3385X + 5.0400 | 0.9600 | POV | |
| −23 | Y = 0.2554X − 7.4184 | 0.8129 | MC |
Colaric et al. (2005) were insistent that there were correlations between chemical and sensory attributes, in addition to sorbitol and sucrose being the factors strongly linked to taste, with correlation coefficients of r = 0.83 and 0.82, respectively. Thus, we propose that POV and MC, in addition to TVB-N content, have linear relationships to OA. In addition, TVB-N content by itself is indicated to be the most consistently correct factor in determining OA.
With 30% of major South Korean grocery stores keeping frozen meet above −18°C, and most reporting shelf lives exceeding 6 months (Choi et al., 2011), a drastic reduction in consumer preference is to be expected. This necessitates a re-evaluation of the recommended shelf lives of frozen minced beef products based on practical storage temperatures. The results of our study indicate that 2-, 4-, and 6-month expiry dates are appropriate for 10 and 15% fat meat content frozen minced beef products kept at −5, −15, and −23°C, respectively, to retain an OA score greater than 3.7.
Conclusion
Despite the fact that frozen meat products should be kept below −18°C in South Korea, in practical conditions, the vast majority of grocery stores keep them above −18°C. In spite of the fact that storage of frozen minced beef products at −5 and −15°C for a duration of 6 months causes no microbial safety concerns, there is a notable degradation in quality. Lower OA scores were strongly correlated with larger increases in TVB-N content and POV, as well as a reduction in MC, as a result of increased temperatures and extended frozen storage durations. Deterioration of these quality factors caused further degradation in sensory properties of minced beef products kept at higher temperatures, resulting in reduced consumer satisfaction.
Shelf life of frozen minced beef products decreased as storage temperatures increased. Mandating all grocery stores and distributors keep freezers below −18°C is not a practical, or even workable, solution. Thus, it is expected that the findings of this paper would prompt producers to label their products with precise shelf lives based on practical distribution environments. The effect of fat meat content on quality changes in minced beef products kept in frozen storage was less significant; a finding of the greatest importance is that different storage temperatures necessitate different shelf lives to maintain minced beef product quality. Since quality factors requiring intensive management vary with different storage temperatures, the practical distribution environment needs to be assessed and the correct factors managed. Universal global standards deem it necessary to identify and control important quality factors with practical distribution environments and consumer preferences in mind.
Authors’ contributions
HSL performed experiments, analyzed the data, and wrote the draft manuscript. YIP and SHK supervised this work and edited the manuscript. All authors read and approved the final manuscript.
Acknowledgements
The authors thank Dr. Chul-Soo Lee of the Korea Food Science Institute for his valuable comments on this work.
Availability of data and materials
All data generated or analyzed during this study are included in this published article. We did not get IRB approval for this study according to Article 13 of the Enforcement Rules of the Act on Bioethics in Republic of Korea, “For those studies that directly manipulate the subject or its environment, one that evaluates taste or quality using food permitted for sale, IRB approval is not required because Korean law stipulates that it is subject to IRB review exemption. Available from: https://www.irb.or.kr/menu02commonDeliberation.aspx
Funding
Not applicable.
Conflict of interest
No competing financial interests exist.
REFERENCES
Akköse, A. and Aktaş, N., 2008. Determination of glass transition temperature of beef and effects of various cryoprotective agents on some chemical changes. Meat Science 80(3): 875–878. 10.1016/j.meatsci.2008.04.006
Anderson, E.T. and Berry, B.W., 2001. Effects of inner pea fiber on fat retention and cooking yield in high fat ground beef. Food Research International 34(8): 689–694. 10.1016/S0963-9969(01)00089-8
Cai, J., Chen, Q., Wan, X. and Zhao, J., 2011. Determination of total volatile basic nitrogen (TVB-N) content and Warner–Bratzler shear force (WBSF) in pork using Fourier transform near infrared (FT-NIR) spectroscopy. Food Chemistry 126(3): 1354–1360. 10.1016/j.foodchem.2010.11.098
Cai, Z., Ruan, Y., He, J., Dang, Y., Cao, J., Sun, Y., Pan, D. and Tian, H., 2020. Effects of microbial fermentation on the flavor of cured duck legs. Poultry Science 99: 4642–4652. 10.1016/j.psj.2020.06.019
Choi, M.S., Choi, J.A., Kim, M.H. and Park, G.J., 2011. The comparison and distribution of temperatures established in display stands and food surfaces for cold and frozen foods in large discount stores in Korea. Journal of Food Hygiene and Safety 26(4): 308–314. Available at: https://www.koreascience.or.kr/article/JAKO201111436229601.pdf.
Colaric, M., Veberic, R., Stampar, F. and Hudina, M., 2005. Evaluation of peach and nectarine fruit quality and correlations between sensory and chemical attributes. Journal of the Science of Food and Agriculture 85(15): 2611–2616. 10.1002/jsfa.2316|
Dharmaveer, S., Rajkumar, V. and Mukesh, K.P., 2007. Quality and shelf-life of smoked chevon sausages packed under vacuum. American Journal of Food Technology 2(4): 238–247. 10.3923/ajft.2007.238.247
Goepfert, J.M., 1977. Aerobic plate count and Escherichia coli determination on frozen ground-beef patties. Applied and Environmental Microbiology 34(4): 458–460. Available at: https://aem.asm.org/content/aem/34/4/458.full.pdf
Gray, J.I., Gomaa, E.A. and Buckley, D.J., 1996. Oxidative quality and shelf life of meats. Meat Science 43(S1): 111–123. 10.1016/0309-1740(96)00059-9
Grujic, R., Petrovic, L., Pikula, B. and Amidzic, L., 1993. Definition of the optimum freezing rate. Meat Science 33(3): 301–318. 10.1016/0309-1740(93)90003-Z
Gunstone, F.D. and Norris, F.A., 1983. Lipid in foods: chemistry, biochemistry and technology. Pergamon Press Inc., Oxford, UK, p. 58.
Hong, G.P., Lee, S. and Min, S.G., 2003. Studies on physicochemical properties of spreadable liver sausage during storage period. Korean Journal for Food Science of Animal Resources 99: 56–62. Available at: https://www.koreascience.or.kr/article/JAKO200311921585876.pdf.
International Organization for Standardization 16779 (ISO 16779), 2015. Available at: https://www.iso.org/obp/ui/#iso:std:iso:16779:ed-1:v1:en (accessed on 19 May 2020).
Jeong, J.W., Jo, J.H., Kim, Y.D., Kwon, D.J. and Kim, Y.S., 1991. Effect of freeze storage temperature on the storage stability of frozen mandu. Korean Journal of Food Science and Technology 23(5): 527–531. Available at: http://www.koreascience.or.kr/article/ArticleFullRecord.jsp?cn=SPGHB5_1991_v23n5_527 (accessed on 17 February 2020).
Keeton, J.T., 1983. Effects of fat and NaCl/phosphate levels on the chemical and sensory properties of pork patties. Journal of Food Science 48(3): 878–881. 10.1111/j.1365-2621.1983.tb14921.x|
Laleye, L.C., Lee, B.H., Simard, R.E., Carmichael, L. and Holley, R.A., 1984. Shelf life of vacuum—or nitrogen—packed pastrami: effects of packaging atmospheres, temperature and duration of storage on microflora changes. Journal Food Science 49(3): 827–831. 10.1111/j.1365-2621.1984.tb13222.x
Lara, M.S., Gutierrez, J.I., Timón, M. and Andrés, A.I., 2011. Evaluation of two natural extracts (Rosmarinus officinalis L. and Melissa officinalis L.) as antioxidants in cooked pork patties packed in MAP. Meat Science 88(3): 481–488. 10.1016/j.meatsci.2011.01.030
Lee, G.H., 1995. The Food chemistry, Version 2.0. Hyeoung Sul Publishing Co., Seoul, Korea, pp. 273–284, 312.
Lee, M.H., Lee, S.K., Choi, S.H. and Kim, L.S., 2001. The meat product quality management. Sunjin Publ. Co., Seoul, Korea, pp. 16–46.
Limbo, S., Torri, L., Sinelli, N., Franzetti, L. and Casiraghi, E., 2010. Evaluation and predictive modeling of shelf life of minced beef stored in high-oxygen modified atmosphere packaging at different temperatures. Meat Science 84(1): 129–136. 10.1016/j.meatsci.2009.08.035
Marian, G., Paulina, D.K., Renata, S. and Mariusz, R., 2018. The effect of freezing storage on physical and chemical properties of wild boar meat. Czech Journal of Food Sciences 36(6): 487–493. 10.17221/62/2018-CJFS
Mariana, U., David, M. and Mario, E., 2014. Fat content has a significant impact on protein oxidation occurred during frozen storage of beef patties. Food Science and Technology 56: 62–68. 10.1016/j.lwt.2013.10.040
Meilgaard, M., Civille, G.V. and Carr, B.T., 2015. Sensory evaluation techniques. 5th ed. CRC Press, Boca Raton, FL.
Ministry of Food and Drug Safety (MFDS), 2018a. Available at: https://www.mfds.go.kr/brd/m_374/list.do (accessed on 19 May 2020).
Ministry of Food and Drug Safety (MFDS), 2018b. Available at: http://www.mfds.go.kr. Korean Food Standards (accessed on 19 May 2020).
Mónica, A., David, M., Jesús, V. and Mario, E., 2016. The application of natural antioxidants via brine injection protects Iberian cooked hams against lipid and protein oxidation. Meat Science 116: 253–259. 10.1016/j.meatsci.2016.02.027
Moskowitz, H., 1988. Applied sensory analysis of food. CRC Press, Boca Raton, FL, pp. 43–71.
Niana, Y., Zhaoc, M., Colm, P.O., Gerard, D, Joseph, P.K. and Paul, A., 2017. Assessment of physico-chemical traits related to eating quality of young dairy bull beef at different ageing times using Raman spectroscopy and chemometrics. Food Research International 99: 778–789. 10.1016/j.foodres.2017.06.056
Ozer, O. and Saricoban, C., 2010. The effects of butylated hydroxyanisole, ascorbic acid, and α-tocopherol on some quality characteristics of mechanically deboned chicken patty during freeze storage. Czech Journal of Food Sciences 28(2): 150–160. 10.17221/160/2009-CJFS
Park, H.G., Oh, H.R., Kang, J.W., Lee, G.T. and Jin, G.B., 1998. The science and technology of meat product. Sunjin Publ. Co., Seoul, Korea, pp. 269–272, 385–386.
Ramalingam, V., Song, Z. and Hwang, I.H., 2019. The potential role of secondary metabolites in modulating the flavor and taste of the meat. Food Research International 122: 174–182. 10.1016/j.foodres.2019.04.007
Song, Y., Liu, L., Shen, H., You, J. and Luo, Y., 2011. Effect of sodium alginate-based edible coating containing different anti-oxidants on quality and shelf life of refrigerated bream (Megalobrama amblycephala). Food Control 22(3–4): 608–615. 10.3390/antiox8100429
Terasaki, M., Kallkwa, M., Fuiita, E. and Ishii, K., 1965. Studied on the flavor of meats. Part 1. Formation and degradation of inosinic acids in meats. Agricultural and Biological Chemistry 29(3): 208–215. 10.1080/00021369.1965.10858377
Tobin, B.D., O’Sullivan, M.G., Hamill, R.M. and Kerry, J.P., 2013. The impact of salt and fat level variation on the physiochemical properties and sensory quality of pork breakfast sausages. Meat Science 93(2): 142–152. 10.1016/j.meatsci.2012.02.032
Utrera, M., Morcuende, D. and Estevez, M., 2014a. Fat content has a significant impact on protein oxidation occurred during frozen storage of beef patties. Food Science Technology 56: 62–68. 10.1016/j.lwt.2013.10.040
Utrera, M., Morcuende, D. and Estevez, M., 2014b. Temperature of frozen storage affects the nature and consequences of protein oxidation in beef patties. Meat Science 96: 1250–1257. 10.1016/j.meatsci.2013.10.032
Wannee, T. and Frederick, L., 2017. The effects of replacing pork fat with cold-pressed coconut oil on the properties of fresh sausage. Journal of Food Research 6(6): 83–91. 10.5539/jfr.v6n6p83
Witte, V.C., Krause, G.F. and Bailey, M.E., 1970. A new extraction method for determining 2-thiobarbituric acid values of pork and beef during storage. Journal Food Science 35(5): 582–585. 10.1111/j.1365-2621.1970.tb04815.x
Yun, S.H., Yoon, J.Y. and Lee, S.R., 1996. Retail distribution temperature and quality status of fried-frozen Korean meat ball products. Korean Journal of Food Science and Technology 28(4): 657–662. Available at: http://www.koreascience.or.kr/article/ArticleFullRecord.jsp?cn=SPGHB5_1996_v28n4_657 (accessed on 17 February 2020).
Zaritzky, N., 2012. Physical–chemical principles in freezing. In: Sun, D.W. (ed.), Handbook of frozen food processing and packaging. CRC Press, Boca Raton, FL, pp. 3–38. 10.1201/b11204