
Download


Original Article
Rapid and nondestructive identification of Belgian and Netherlandish trappist beers by front-face synchronous fluorescence spectroscopy coupled with multiple statistical analysis
Jin Tan*, Ming-Fen Li
Tianjin Key Laboratory of Food Biotechnology, College of Biotechnology and Food Science, Tianjin University of Commerce, Tianjin 300134, People’s Republic of China.
Abstract
Front-face synchronous fluorescence spectroscopy (FFSFS) was applied for the rapid and noninvasive recognition of Belgian and Netherlandish Trappist beers against non-Trappist beers. The front-face synchronous fluorescence spectra at wavelength intervals (Δλ) of 30 and 60 nm for 80 bottles of beer, including 41 Trappist and 39 non-Trappist beers, were acquired in a 5 × 10 mm fused-quartz cuvette settled in a traditional right-angle sample compartment. The discrimination model was constructed by either principal component analysis (PCA) combined with linear discriminant analysis (LDA) or partial least squares-discriminant analysis (PLS-DA). Both PCA–LDA and PLS-DA models were validated by full (leave-one-out) cross-validation and k-fold cross-validation (k = 5). The PCA–LDA model presents reliable discrimination performance, with the cross-validated sensitivity (true positive rate) and specificity (true negative rate) in the range of 82.9–85.4% and 71.8–76.9%, respectively. The misclassification mainly occurs to a small portion of ambiguous Trappist and non-Trappist samples such as Abbey beers, which are rather similar to Trappist beers.
Key words: front-face fluorescence, linear discriminant analysis (LDA), partial least squares-discriminant analysis (PLS-DA), principal component analysis (PCA), Trappist beers
*Corresponding author: Jin Tan, Tianjin Key Laboratory of Food Biotechnology, College of Biotechnology and Food Science, Tianjin University of Commerce, Tianjin 300134, People’s Republic of China. E-mail: [email protected]
Submitted: 10 November 2020; Accepted: 21 January 2021; Published: 7 February 2021
© 2020 Codon Publications
This is an Open Access article distributed under the terms of the Creative Commons Attribution-NonCommercial-ShareAlike 4.0 International (CC BY-NC-SA 4.0). License (http://creativecommons.org/licenses/by-nc-sa/4.0/)
Introduction
Trappist beer is a renowned class of craft beer brewed by Trappist monks. It originated in 1664 in La Trappe Abbey, a Cistercian monastery in France. Now there are 13 monasteries worldwide brewing authentic Trappist – product—six in Belgium, two in the Netherlands, and one each in Austria, France, Italy, the United Kingdom and the United States (International Trappist Association, 2020).
Owing to their unique property, limited yield and high value, the brand identification of Trappist beers has attracted attention of many researchers (Cajka et al., 2010; Di Egidio et al., 2011; Engel et al., 2012; Mannina et al., 2016; Mattarucchi et al., 2010; Mignani et al., 2013; Pierna et al., 2012; Weeranantanaphan and Downey, 2010). Most of these methods rely on various spectroscopic techniques, including nuclear magnetic resonance (NMR), ultraviolet (UV)-visible, near-infrared (NIR), middle-infrared (MIR) and Raman, or the chromatographic profiles of characteristic compounds. For instance, Mannina et al. (2016) built classification models toward Rochefort 8 Trappist beers, other Trappist beers and non-Trappist beers by hydrogen-1 nuclear magnetic resonance (1H NMR) spectroscopy. Mattarucchi et al. (2010) applied liquid chromatography with mass spectrometry (LC–MS) profiling to authenticate Rochefort Trappist beers as part of a program on traceability funded by the European Commission. Only three samples (3.5% of the test set) were wrongly classified. Pierna et al. (2012) discriminated Rochefort 8 Trappist beers from other Trappist beers, as well as other special beers, by using three vibrational spectroscopic techniques (NIR, MIR and Raman). The overall classification rates were in the range of 82–100%. Weeranantanaphan and Downey (2010) achieved the identity confirmation of Rochefort Trappist beers thru UV spectroscopy. High correct classification rates (>90%) were obtained thru partial least squares-discriminant analysis (PLS-DA).
Among various spectroscopic techniques, fluorescence spectroscopy possessing the advantage of high sensitivity and selectivity has been shown to be greatly useful for food authentication (Karoui and Blecker, 2011). Basically, there are two geometries for fluorescence measurement: right-angle and front-face. Unlike the traditional right-angle mode, the front-face procedure measures the fluorescence excited and emitted on the surface of the tested sample. Free of sample dilution with proper solvent needed in the conventional right-angle geometry, the front-face approach can reduce the primary and secondary inner filter effects occurring in strongly absorbing samples. It can reflect the intrinsic fluorescence property of bulk food samples and hence is particularly suitable for rapid and nondestructive food authentication and detection (Karoui and Blecker, 2011). This convenient strategy has been increasingly demonstrated to be competent to deal with different types of food and beverage samples (Ammari et al., 2015; Garcia et al., 2016; Hassoun and Karoui, 2015; Hougaard et al., 2013; Kulmyrzaev et al., 2005; Lenhardt et al., 2014; Liu et al., 2020; Nhouchi et al., 2019; Sikorska et al., 2019). However, to the best of our knowledge, there is no report on the investigation of the front-face fluorescence properties of Trappist beers.
Herein, we report the utilization of front-face fluorescence strategy for the identification of Belgian and Netherlandish Trappist beers from their analogues. The discrimination of these Trappist beers from other European non-Trappist special beers will be performed based on the combination of front-face synchronous fluorescence spectroscopy (FFSFS) and multivariate statistical analysis. Typically, measurements of front-face fluorescence require a specific variable angle front-face cuvette holder to facilitate sample orientation or a triangle shaped cuvette. However, the conventional setup of a fluorescence spectrofluorometer is for right-angle geometry. It is always hard for those researchers who lack the special equipment to take the advantage of front-face fluorescence spectroscopy. To this end, we decided to use modified front-face fluorescence setup. The aim of this work was to show the feasibility of acquiring front-face fluorescence thru traditional right-angle compartment. This novel strategy could be beneficial to those researchers who lack access to special equipment.
Materials and methods
Samples
Eighty bottles of European beer were bought from certified online sellers from February to October 2016. These samples comprised 41 Trappist beers from eight Monasteries in either Belgium or the Netherlands and 39 non-Trappist beers, mainly from Belgium. As shown in Table 1, for each brand, at least two bottles from two different batches (typically 6 months apart referring to production date) were collected to reflect the batch-to-batch variation, except for several brands of which only one bottle was purchased due to unavailability. The authenticity of these beers was guaranteed by the certified online sellers and the samples were kept in dark at room temperature prior to test. The length of storage time prior to testing was less than 1 month. The beers were decapped and ultrasonicated for 20 min to eliminate the interference of carbon dioxide prior to fluorescence test. The weight and volume of samples did not change significantly after the degassing process, indicating that there was no evaporation of ethanol and other compounds during the process.
Table 1. Information of 80 beer samples (41 Trappist and 39 non-Trappist samples) investigated in this study.
| Classification | Sample code | Trade mark | Country of origin | Number of samples |
|---|---|---|---|---|
| Trappist | 1 | Achel Blond | Belgium | 1 |
| 2-3 | Achel Brune | Belgium | 2 | |
| 4-5 | Chimay Blue | Belgium | 2 | |
| 6-7 | Chimay Gold | Belgium | 2 | |
| 8-9 | Chimay Red | Belgium | 2 | |
| 10-11 | Chimay White | Belgium | 2 | |
| 12-13 | La Trappe Double | The Netherlands | 2 | |
| 14-15 | La Trappe Quadruple | The Netherlands | 2 | |
| 16-17 | La Trappe Triple | The Netherlands | 2 | |
| 18-19 | Orval | Belgium | 2 | |
| 20-23 | Rochefort 6 | Belgium | 4 | |
| 24-28 | Rochefort 8 | Belgium | 5 | |
| 29-33 | Rochefort 10 | Belgium | 5 | |
| 34-35 | Westmalle Double | Belgium | 2 | |
| 36-37 | Westmalle Triple | Belgium | 2 | |
| 38-39 | Westvleteren 12 | Belgium | 2 | |
| 40-41 | Zundert | The Netherlands | 2 | |
| Non-Trappist | 1-2 | 1664 Blanc | France | 2 |
| 3-4 | 1664 Rose | France | 2 | |
| 5 | Delirium Nocturnum | Belgium | 1 | |
| 6-7 | Delirium Tremens | Belgium | 2 | |
| 8-9 | Duvel | Belgium | 2 | |
| 10-11 | Duvel Triple Hop | Belgium | 2 | |
| 12-13 | Hoegaarden Grand Cru | Belgium | 2 | |
| 14 | Hoegaarden Rose | Belgium | 1 | |
| 15 | Hoegaarden Wit Blanche | Belgium | 1 | |
| 16-17 | Hopus | Belgium | 2 | |
| 18-19 | Kasteel Donker | Belgium | 2 | |
| 20-21 | Kasteel Rouge | Belgium | 2 | |
| 22-23 | Kasteel Triple | Belgium | 2 | |
| 24-25 | KVB | Belgium | 2 | |
| 26-27 | Leffe Blonde | Belgium | 2 | |
| 28-29 | Leffe Brune | Belgium | 2 | |
| 30-31 | Maredsous Brune | Belgium | 2 | |
| 32-33 | Steen Brugge Wit Blanche | Belgium | 2 | |
| 34-35 | Vedett Extra Blond | Belgium | 2 | |
| 36-37 | Vedett Extra Ordinary | Belgium | 2 | |
| 38-39 | Vedett Extra White | Belgium | 2 |
Front-face synchronous fluorescence spectroscopy
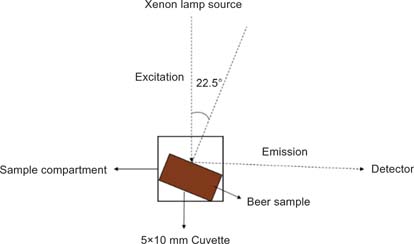
Fluorescence spectra were obtained with an F-4600 spectrofluorometer (Hitachi, Japan) with a 950-W xenon lamp source for excitation. The slit widths for excitation and emission were 5 nm and 10 nm, respectively. The front-face geometry of raw beers was used for the spectra acquisition with a 5 × 10-mm fused-quartz cuvette (Figure 1). The cuvette was placed in the sample compartment, upper right tilted in relation to the excitation beam (the excitation beam was emitted from the top and the detector was located on the right side). The incidence angle of the excitation radiation which was the angle made by the excitation beam hitting the cuvette surface and the line perpendicular to the surface was calculated to be 22.5° (Karoui and Blecker, 2011). The excitation and emission in the 250–600-nm range with a step of 1 nm were scanned simultaneously. The scanning speed was 1,200 nm/min. The constant wavelength interval (Δλ) between excitation and emission was set at 30 or 60 nm (Sikorska et al., 2004, 2008). Fluorescence intensities were plotted as a function of the excitation wavelength. For each sample, three spectra were measured successively and the average of the three measurements was used for further analysis.
Figure 1. Scheme for the placement of the cuvette in the sample compartment for conventional right-angle geometry.
Statistical analysis
Prior to statistical analysis, several spectral data pretreatments, including standard normal variate (SNV), multiplicative scatter correction (MSC), and first and second derivative preprocesses, were tested. The SNV and MSC are usually adopted to eliminate the interference from the scattering light occurring on solid surface (Barnes et al., 1989; Geladi et al., 1985). The first and second derivatives are always employed to correct for baseline variation and enlarge spectral differences. In the present work, these were performed using the Savitzky and Golay method (1964) with second-order smoothing polynomials thru 11 smoothing points. The spectral data pretreatments, principal component analysis (PCA) and PLS-DA were carried out by The Unscrambler 9.7 (CAMO, Norway) software. The linear discriminant analysis (LDA) was performed using IBM SPSS 19.0 (IBM, USA).
The PCA was executed after mean-centering as a default option in The Unscrambler. Discrimination models were built using PCA–LDA and PLS-DA. In PCA–LDA, the first three principal components (PCs) obtained were used as variables for the following LDA. In PLS-DA, each sample in the calibration set was assigned a dummy variable (set as Trappist beers 1 and non-Trappist beers 2). The binary discrimination of the samples was based on the cut-off value of 1.5 (the samples obtaining the values smaller than 1.5 were identified to be Trappist beers, while those with the values larger than 1.5 were judged to be non-Trappist ones).
Method validation
Both PCA–LDA and PLS-DA models were validated by full (leave-one-out) cross-validation and k-fold cross-validation (k = 5). In the 5-fold cross-validation, all the samples were randomly split into five subsets of the same size (n = 16), where a given subset was left out to be used as a test set, while the remaining four subsets were used to yield the calibration rule. The process was repeated for five times until each group was left out once.
After calibration and validation, the sensitivity (true positive rate) and specificity (true negative rate) for each model were obtained. The sensitivity was measured as the fraction of Trappist beers having a positive test result (correctly identified as Trappist beers), and the specificity was calculated as the fraction of non-Trappist beers having a negative test result (correctly recognized as non-Trappist beers). For the PLS-DA model, the corresponding root mean square error of calibration (RMSEC), coefficient of determination of calibration (R2c), root mean square error of cross-validation (RMSECV), coefficient of determination for cross-validation (R2cv), root mean square error of prediction (RMSEP) and coefficient of determination for prediction (R2p) were calculated. The optimal number of PLS components was decided by plotting the RMSECV versus the number of components and determining the minimum of the plot.
Results and Discussion
Synchronous front-face fluorescence spectra
The synchronous fluorescence spectra of the raw beers were scanned at Δλ of 30 and 60 nm. It has been shown that the synchronous fluorescence spectra of beers at these wavelength intervals reflect the main fluorescent components and yield generally higher fluorescent intensities (Sikorska et al., 2004, 2008). Conventionally, a front-face sample holder or a special accessory of spectrofluorometer is mandatory for front-face geometry. Here it is worthy to note that the front-face fluorescence spectra of raw beers were easily obtained with a 5 × 10-mm fused-quartz cuvette settled in the traditional right-angle sample compartment. As shown in Figure 1, such settlement offers an incident angle of 22.5°, which is coincidentally a commonly adopted incident angle in front-face geometry (Karoui and Blecker, 2011). It can produce stable front-face fluorescence signals without resorting to additional accessory for front-face mode. This convenient utilization of traditional right-angle sample compartment for the measurement of front-face fluorescence must be practicable for all the concentrated liquid samples which are impossible to be directly tested in the traditional right-angle geometry without any dilution.
The typical synchronous fluorescence spectra of the tested beers at Δλ of 30 nm are shown in Figure 2. The synchronous fluorescence spectra at Δλ of 60 nm are analogous to those at Δλ of 30 nm, except for a slight wavelength blue shift. The beers generally display similar profiles of synchronous fluorescence. The short-wavelength emission between 250 nm and 300 nm is assigned to aromatic amino acids, while the long-wavelength emission bands in the range of 350–500 nm are the combined contribution of multiple fluorophores, including phenolics and vitamin B group such as riboflavin (vitamin B2) (Sikorska et al., 2004, 2008). For most of the brands, the two bottles from different batches show parallel spectra, suggesting that the batch-to-batch variation is not significant. However, for different brands and classes, the shapes of spectra and the fluorescence intensities at various excitation wavelength (λex) values are distinct.
Figure 2. Landscape map of the front-face synchronous fluorescence spectra of 80 beer samples at Δλ of 30 nm. The samples 1–80 are listed in alphabetic order as in Table 1. The first 41 samples are Trappist beers and the rest are non-Trappist beers.
From the information provided by the synchronous fluorescence spectra, the tested Trappist beers can be divided into three groups. The first one presents plenty of fluorescence information in both short-wavelength and long-wavelength emissions. Except the relative weak fluorescence in the short-wavelength range, their spectra show maximum fluorescence at λex = 380 nm along with two shoulder peaks at λex = 415 and 470 nm. This group involves Achel Blonde, Chimay Gold, Chimay White, La Trappe Quadruple, La Trappe Triple and Westmalle Triple, among which Achel Blonde and La Trappe Triple show the highest fluorescence intensity. The fluorescence of the second group is weaker than the first one (P < 0.05). Besides, the shapes of fluorescence spectra between the two groups are quite different. Unlike the first group, which has an obvious maximum fluorescence, the spectra of the second group display two parallel fluorescence emissions of around λex = 380 and 420 nm. This group consists of Orval and Zundert. The remaining not mentioned Trappist beers constitute the last and the largest group, the fluorescence intensities of which are significantly lower than the first two groups, indicating the possible deficiency of aromatic amino acids, phenolics and vitamin B group compounds in these beers.
Regarding the non-Trappist beers, most of them are highly fluorescent in both short- and long-wavelength regions, just like the first group of Trappist beers. The fluorescence of Hoegaarden Grand Cru is even stronger than those of all the Trappist beers. On the other hand, Kasteel Donker, Leffe Brune and Maredsous Brune are the several exceptions emitting rather weak fluorescence in the whole wavelength range. Considering high similarity between the Trappist and non-Trappist beers in terms of synchronous fluorescence spectra, their differentiation based on synchronous fluorescence may be highly challenging, especially for the first group of Trappist beers which owns comparable strong fluorescence, in comparison to most non-Trappist beers and the three brands of non-Trappist beers whose emissions are similarly weak as the typical Trappist beers. However, whether this approach works or not depends on the results of multivariate statistical analysis, instead of observations made by the naked eye.
Most relevant investigations employing vibrational spectroscopic techniques have paid more attention to the spectral differences between the Trappist and non-Trappist beers instead of differences in their chemical compositions (Di Egidio et al., 2011; Engel et al., 2012; Mignani et al., 2013; Pierna et al., 2012; Weeranantanaphan and Downey, 2010). Owing to the high complexity of the chemical composition of beer samples and the strong resemblance between the Trappist and non-Trappist beers, only a little information can be found about the actual difference between the two classes. Two examples utilizing chromatography and NMR spectroscopy have provided more specific information. In the aspect of volatile components, Cajka et al. (2010) studied the volatile fingerprints of Trappist and non-Trappist beers by gas chromatography–time-of-flight mass spectrometry (GC–TOFMS). The two classes showed similar GC profiles with a slightly different composition of volatiles. On the other side, Mannina et al. (2016) took advantage of the 1H NMR spectroscopy and found that Trappist beers contain higher amounts of formic and pyruvic acids but lower amounts of acetic acid and alanine compared to non-Trappist ones.
Principal component analysis
Among the several data pretreatments, the first derivative preprocess using the Savitzky and Golay (1964) method with second-order smoothing polynomials thru 11 smoothing points gave the highest correct classification rates. Besides, the combination of the first derivative with either SNV or MSC did not help improve the discrimination. Thus, only the first derivative preprocess was adopted to eliminate the baseline noise and amplify spectral differences.
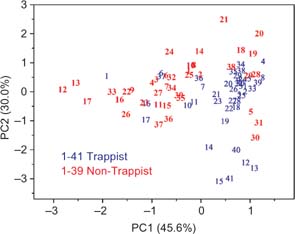
In order to reduce variable dimension, find underlying variables and give preliminary classification, the PCA was first executed. Figures 3 and 4 show the obtained 3D and 2D PCA score plots, respectively. The first two and three PCs account for 75.6% and 82.5% of the total variance, respectively. Although the Trappist and non-Trappist beers could not be isolated completely by either 2D or 3D PCA, a general trend can be perceived. As can be seen in Figure 4, most Trappist beers earn positive scores along the first PC, while the majority of non-Trappist beers locate in the second and third quadrants. Nevertheless, neither Trappist nor non-Trappist beers are clustered tightly, indicating the huge disparity between different brands within the same class. The major difference between the two classes is projected by the first PC contributing 45.6% of the total variance.
Figure 3. 3D PCA score plot of 80 beer samples based on their synchronous front-face fluorescence spectra at Δλ of 30 nm. Blue dots: Trappist beers; red dots: non-Trappist beers.
Figure 4. 2D PCA score plot of 80 beer samples based on their front-face synchronous fluorescence spectra at Δλ of 30 nm. Blue 1–41: Trappist beers; red 1–39: non-Trappist beers. The serial sample numbers are in accordance with the sample codes listed in Table 1.
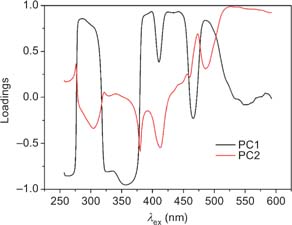
The examination of PCA loadings can reveal underlying variables. The corresponding PCA loadings (Figure 5) suggest that the first PC is negatively correlated to intensities in the wavelength regions of 280–310, 380–400 and 420–450 nm. These ranges are in accordance with the aforementioned major fluorescence emissions. The beers showing stronger fluorescence in these ranges will earn more negative scores along the first PC, and vice versa. Hence, one important criterion of PCA to separate the two classes seems the fluorescence intensity. The majority of Trappist beers show weak-to-moderate fluorescence, while most non-Trappist beers are more fluorescent. Such difference may be related to the ingredients and brewing process employed by different monasteries and manufacturers. For example, humulinones, a group of humulone derivatives originating from the hop soft resins, are found at concentrations of up to 13.3 mg/L in some Belgian unique dry-hopped Trappist beers, and are estimated to be responsible for up to 28% of their bitterness (Ferreira et al., 2018). While for other typical non-dry-hopped Belgian beers, the contents of humulinones are often below 1.7 mg/L (Ferreira et al., 2018). Several exceptional samples that fall in the region of the opposite class are Achel Blond, Chimay Gold, Chimay White, La Trappe Triple, Westmalle Triple, Kasteel Donker, Leffe Brune and Maredsous Brune. These beers present similar fluorescence profiles to the opposite class and cannot be discerned clearly to be Trappist or non-Trappist beers by PCA. As an unsupervised pattern recognition method, the PCA is incompetent for the complete isolation of the Trappist and non-Trappist beers. Such challenging task is left to the supervised LDA.
Figure 5. PCA loading plot based on the front-face synchronous fluorescence spectra at Δλ of 30 nm.
Linear discriminant analysis
The binary discrimination between the two classes was then performed by the supervised classification technique LDA, which was based on the first three PC scores obtained. The classification results are shown in Table 2. The cross-validated sensitivity (true positive rate) and specificity (true negative rate) are in the range of 82.9–85.4% and 71.8–76.9%, respectively. In general, the obtained sensitivity is better than the specificity. This means that the LDA discriminant model will be more accurate for the identification of Trappist beers, while may make more mistakes facing some non-Trappist beers which are highly similar to the Trappist beers. Besides, similar results were obtained at Δλ of 30 and 60 nm, demonstrating that wavelength interval is not dominant for discrimination. Synchronous spectra at Δλ of 30 and 60 nm provide comparable fluorescence information.
Table 2. Results of PCA–LDA and PLS-DA classification according to Trappist/non-Trappist beer samples based on synchronous fluorescence spectra.
| Δλ (nm) |
Discrimination model | Calibration (%) | Full cross-validation (%) | Five-fold cross-validation (%) | |||
|---|---|---|---|---|---|---|---|
| Sensitivity | Specificity | Sensitivity | Specificity | Sensitivity | Specificity | ||
| 30 | PCA–LDA | 82.9 | 76.9 | 82.9 | 74.4 | 82.9 | 76.9 |
| PLS-DA | 92.7 | 76.9 | 85.4 | 74.4 | 87.8 | 71.8 | |
| 60 | PCA–LDA | 87.8 | 71.8 | 82.9 | 71.8 | 85.4 | 71.8 |
| PLS-DA | 97.6 | 76.9 | 95.1 | 64.1 | 85.4 | 69.2 | |
Δλ: wavelength interval.
In cross-validation, 14.6–17.1% of the Trappist beers and 23.1–28.2% of the non-Trappist beers are classified in the wrong class. The mis-classed Trappist and non-Trappist beers during cross-validation agree well with the PCA results. All the mis-classed Trappist beer samples are the so-called ‘triple’ or ‘blond’ ales (Achel Blond, Chimay White, La Trappe Triple and Westmalle Triple). All these beers show relatively higher fluorescence than other Trappist beer samples and are more prone to be incorrectly recognized as non-Trappist beers. Contrarily, several non-Trappist beers are frequently misidentified to be Trappist beers, including Delirium Nocturnum, Kasteel Donker, Leffe Brune and Maredsous Brune; these are the so-called ‘quadruple’ or ‘brune’ ales with weaker fluorescence, darker color and relatively higher alcohol content (6.6–11% ABV). Most of these non-Trappist beers, although not certified to be authentic Trappist products, belong to the so-called Abbey beers, which are also produced by the authorization of certain monasteries. These Belgian monastic style ales possess quite similar appearances and fluorescent properties to that of certified Trappist beers, and hence are rather difficult to be distinguished solely by fluorescence spectroscopy. It has been revealed that some Abbey beers, which also adopt the same dry hopping process as the typical Trappist beers, contain similar levels of humulinones and bitterness (Ferreira et al., 2018).
Considering the performance of FFSFS itself is not very satisfactory, the possible procedures to enhance the discrimination power of FFSFS may involve the data fusion of other vibrational spectroscopic techniques such as UV-visible, NIR, MIR and Raman. These spectroscopic approaches have been demonstrated to be highly effective in the rapid beer and wine analysis (Chapman et al., 2019). The coupling of fluorescence spectroscopy with such vibrational spectroscopic techniques may be helpful. For instance, the UV-visible spectroscopy has shown some complementary effect to the fluorescence spectroscopy. The data fusion of UV-visible and fluorescence spectroscopic techniques is proved to yield synergic effect toward the brand recognition of Chinese larger beers (Tan et al., 2015). Nevertheless, although the FFSFS solely is incompetent for the 100% correct classification of such highly similar samples as the Trappist and non-Trappist beers, it may have a place to show its prowess when facing those samples that are not extremely analogous, for example, industrial and craft beers. Compared with the recently reported NMR-based method (Palmioli et al., 2020), the FFSFS strategy is more rapid, inexpensive and noninvasive, and hence is particularly promising for online routine analysis.
Partial least squares-discriminant analysis
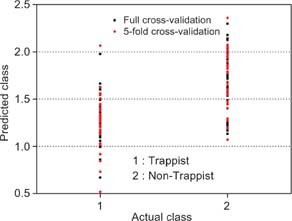
Apart from PCA–LDA, the discrimination of Trappist beers from non-Trappist beers was also made by PLS-DA. In calibration, the Trappist and non-Trappist beers are assigned a dummy variable as 1 and 2, respectively. In prediction, the cut-off value is 1.5. As shown in Figure 6, the obtained discriminant variables for the majority of Trappist beers in cross-validation are 1.0–1.5. The beers that earned discriminant variables smaller than 1.0 are La Trappe Quadruple and Zundert, suggesting that the PLS-DA model considers them as typical Trappist beers which are most unlikely to be wrongly recognized as non-Trappist beers. On the other hand, the several mis-classified samples exceeding the cut-off value of 1.5 are Achel Blond, Chimay Gold, Chimay White and La Trappe Triple. Among these, Achel Blond obtains the largest discriminant variable of around 2.0, indicating its high similarity to the typical non-Trappist beers.
Figure 6. PLS-DA validation results based on the front-face synchronous fluorescence spectra at Δλ of 30 nm. Class 1: Trappist beer; class 2: non-Trappist beer. The cut-off value is 1.5.
The distribution diversity of the non-Trappist beers is not as severe as that of Trappist beers. However, although the better part gets the discriminant variable values of larger than 1.5, a portion of non-Trappist beers are mistakenly discriminated to be Trappist beers as the discriminant variables are lesser than 1.5. These beers include Delirium Nocturnum, Kasteel Donker, Kasteel Rouge, Leffe Brune and Maredsous Brune. Among these, Leffe Brune and Maredsous Brune obtained minimum discriminant variables adjacent to 1.0. Their fluorescence profiles are extremely analogous to those of the Trappist beers. As a result, they are probably to be wrongly recognized as Trappist beers. On the contrary, 1664 Rose, Hoegaarden Rose, Hoegaarden Wit Blanche and Vedett Extra Blond are the several brands with discriminant variables larger than 2.0. These beers do have distinct appearance than that of typical Trappist beers and it is fairly impossible for these to be mis-classed.
Compared with the PCA–LDA model, the PLS-DA strategy offers a little higher sensitivity but somewhat lower specificity. It can contribute more true positive results toward Trappist beers, however, may wrongly recognize more non-Trappist beers as Trappist beers. The mis-classed Trappist and non-Trappist beers during cross-validations are generally in well agreement with the results of PCA–LDA. Still, relatively low specificity is mainly related to several Abbey beers such as Kasteel Donker, Leffe Brune and Maredsous Brune, which are highly similar to the certified Trappist beers. However, it must be note that although the PLS-DA models provide high sensitivity and acceptable specificity, the R2 values obtained for both calibration and cross-validation are lower than 0.64. This result indicates that the PLS-DA models do not own a good prediction capability. It is impossible to attain consistent high accuracy, and is therefore not recommended.
Conclusions
In conclusion, this study achieves a fast and noninvasive differentiation between Trappist and non-Trappist beers by the utilization of front-face fluorescence spectroscopy thru traditional device for right-angle fluorescence. The discrimination is based on the multivariate statistical analysis of synchronous fluorescence spectra at different λex values originating from the intrinsic fluorophores in beers, including aromatic amino acids, phenolics and vitamin B group compounds. Front-face synchronous fluorescence can provide useful information for the classification of typical Trappist/non-Trappist beers. The great advantage of this procedure is the convenient acquisition of front-face fluorescence data of concentrated liquid food/beverage samples thru traditional right-angle sample compartment. The main reasons for moderate results could be the high similarity between the Trappist and non-Trappist beers in fluorescence behaviors and the specificity of the beer fluorescence limited to aromatic amino acids, phenolics and vitamin B group compounds. Although the results are not perfect, this strategy may be attractive as a tool for the development of novel food quality-control techniques. Such application merits further investigation, particularly in the feasibility study toward other types of food and beverage samples and the development of robust calibration models.
REFERENCES
Ammari, F., Redjdal, L. and Rutledge, D.N., 2015. Detection of orange juice frauds using front-face fluorescence spectroscopy and independent components analysis. Food Chemistry 168: 211–217. 10.1016/j.foodchem.2014.06.110
Barnes, R.J., Dhanoa, M.S. and Lister, S.J., 1989. Standard normal variate transformation and de-trending of near-infrared diffuse reflectance spectra. Applied Spectroscopy 43: 772–777. 10.1366/0003702894202201
Cajka, T., Riddellova, K., Tomaniova, M. and Hajslova, J., 2010. Recognition of beer brand based on multivariate analysis of volatile fingerprint. Journal of Chromatography A 1217: 4195–4203. 10.1016/j.chroma.2009.12.049
Chapman, J., Gangadoo, S., Truong, V.K. and Cozzolino, D., 2019. Spectroscopic approaches for rapid beer and wine analysis. Current Opinion in Food Science 28: 67–73. 10.1016/j.cofs.2019.09.001
Di Egidio, V., Oliveri, P., Woodcock, T. and Downey, G., 2011. Confirmation of brand identity in foods by near-infrared transflectance spectroscopy using classification and class-modelling chemometric techniques—the example of a Belgian beer. Food Research International 44: 544–549. 10.1016/j.foodres.2010.11.021
Engel, J., Blanchet, L., Buyden, L.M.C. and Downey, G., 2012. Confirmation of brand identity of a Trappist beer by mid-infrared spectroscopy coupled with multivariate data analysis. Talanta 99: 426–432. 10.1016/j.talanta.2012.06.005
Ferreira, C.S., de Chanvalon, E.T., Bodart, E. and Collin, S., 2018. Why humulinones are key bitter constituents only after dry hopping: comparison with other Belgian styles. Journal of the American Society of Brewing Chemists 76(4): 236–246. 10.1080/03610470.2018.1503925
Garcia, R., Boussard, A., Rakotozafy, L., Nicolasa, J., Potusa, J., Rutledgeb, D.N., et al. 2016. 3D Front-face fluorescence spectroscopy and independent components analysis: a new way to monitor bread dough development. Talanta 147: 307–314. 10.1016/j.talanta.2015.10.002
Geladi, P., MacDougall, D. and Martens, H., 1985. Linearization and scatter-correction for near-infrared reflectance spectra of meat. Applied Spectroscopy 39(3): 491–500. 10.1366/0003702854248656
Hassoun, A. and Karoui, R., 2015. Front-face fluorescence spectroscopy coupled with chemometric tools for monitoring fish freshness stored under different refrigerated conditions. Food Control 54: 240–249. 10.1016/j.foodcont.2015.01.042
Hougaard, A.B., Lawaetz, A.J. and Ipsen, R.H., 2013. Front face fluorescence spectroscopy and multi-way data analysis for characterization of milk pasteurized using instant infusion. LWT—Food Science and Technology 53: 331–337. 10.1016/j.lwt.2013.01.010
International Trappist Association, 2020. The collective figurative trademark Authentic Trappist Product (ATP label). Available at: http://www.trappist.be/en/pages/logo-atp (accessed 09 November 2020).
Karoui, R. and Blecker, C., 2011. Fluorescence spectroscopy measurement for quality assessment of food systems—a review. Food Technology and Biotechnology 4: 364–386. 10.1007/s11947-010-0370-0
Kulmyrzaev, A., Levieux, D. and Dufour, E., 2005. Front-face fluorescence spectroscopy allows the characterization of mild heat treatment applied to milk. Relations with the denaturation of milk proteins. Journal of Agricultural and Food Chemistry 53: 502–507. 10.1021/jf049224h
Lenhardt, L., Zeković, I., Dramićanin, T., Dramićanin, M.D. and Bro, R., 2014. Determination of the botanical origin of honey by front-face synchronous fluorescence spectroscopy. Applied Spectroscopy 68(5): 557–563. https://hdl.handle.net/10520/EJC136153
Liu, H., Ji, Z., Liu, X., Shi, C. and Yang, X., 2020. Non-destructive determination of chemical and microbial spoilage indicators of beef for freshness evaluation using front-face synchronous fluorescence spectroscopy. Food Chemistry 321:126628. 10.1016/j.foodchem.2020.126628
Mannina, L., Marini, F., Antiochia, R., Cesa, S., Magrì, A., Capitani, D., et al. 2016. Tracing the origin of beer samples by NMR and chemometrics: Trappist beers as a case study. Electrophoresis 37(20): 2710–2719. 10.1002/elps.201600082
Mattarucchi, E., Stocchero, M., Moreno-Rojas, J.M., Giordano, G., Reniero, F. and Guillou, C., 2010. Authentication of Trappist beers by LC-MS fingerprints and multivariate data analysis. Journal of Agricultural and Food Chemistry 58: 12089–12095. 10.1021/jf102632g
Mignani, A.G., Ciaccheri, L., Mencaglia, A.A., Ottevaere, H., Báca, E.E.S. and Thienpont, H., 2013. Optical measurements and pattern-recognition techniques for identifying the characteristics of beer and distinguishing Belgian beers. Sensors and Actuators B: Chemical 179: 140–149. 10.1016/j.snb.2012.10.029
Nhouchi, Z., Botosoa, E.P., Chene, C. and Karoui, R., 2019. Potentiality of front-face fluorescence and mid-infrared spectroscopies coupled with partial least square regression to predict lipid oxidation in pound cakes during storage. Food Chemistry 275: 322–332. 10.1016/j.foodchem.2018.09.062
Palmioli, A., Alberici, D., Ciaramelli, C. and Airoldi, C., 2020. Metabolomic profiling of beers: combining 1H NMR spectroscopy and chemometric approaches to discriminate craft and industrial products. Food Chemistry 327: 127025. 10.1016/j.foodchem.2020.127025
Pierna, J.A.F., Duponchel, L., Ruckebusch, C., Bertrand, D., Baeten, V., and Dardenne, P., 2012. Trappist beer identification by vibrational spectroscopy: a chemometric challenge posed at the “Chimiométrie 2010” Congress. Chemometrics and Intelligent Laboratory Systems 113: 2–9. 10.1016/j.chemolab.2011.04.005
Savitzky, A. and Golay, M.J.E., 1964. Smoothing and differentiation of data by simplified least squares procedures. Analytical Chemistry 36: 1627–1639. 10.1021/ac60214a047
Sikorska, E., Gliszczyńska-Świgło, A., Insińska-Rak, M., Khmelinskii, I., De Keukeleire, D. and Sikorski, M., 2008. Simultaneous analysis of riboflavin and aromatic amino acids in beer using fluorescence and multivariate calibration methods. Analytica Chimica Acta 613: 207–217. 10.1016/j.aca.2008.02.063
Sikorska, E., Górecki, T., Khmelinskii, I.V., Sikorski, M. and DeKeukeleire, D., 2004. Fluorescence spectroscopy for characterization and differentiation of beers. Journal of the Institute of Brewing 110(4): 267–275. 10.1002/j.2050-0416.2004.tb00621.x
Sikorska, E., Wójcicki, K., Kozak, W., Gliszczyńska-Świgło, A., Khmelinskii, I., Górecki, T., et al. 2019. Front-face fluorescence spectroscopy and chemometrics for quality control of cold-pressed rapeseed oil during storage. Foods 8: 665. 10.3390/foods8120665
Tan, J., Li, R. and Jiang, Z.-T., 2015. Chemometric classification of Chinese lager beers according to manufacturer based on data fusion of fluorescence, UV and visible spectroscopies. Food Chemistry 184: 30–36. 10.1016/j.foodchem.2015.03.085
Weeranantanaphan, J. and Downey, G., 2010. Identity confirmation of a branded, fermented cereal product by UV spectroscopy: a feasibility study involving a Trappist beer. Journal of the Institute of Brewing 116(1): 56–61. 10.1002/j.2050-0416.2010.tb00398.x