
Download
RESEARCH ARTICLE
Study on identification of red jujube origin by multi-element analysis
Yumiao Lang1*, Yao Cheng1, Hongru Yang1, Qingzhi Chen2, Qian Liu1, Xiaoteng Wang1, Pengsha Bian2*, Xiaoxi Yang1*
1Key Laboratory of Public Health Safety of Hebei Province, College of Public Health, Hebei University, Baoding, 071002, China;
2Hebei Key laboratory of Mineral Resources and Ecological Environment Monitoring, Hebei Research Center for Geoanalysis, Baoding 071002, China
Abstract
In order to explore the feasibility of mineral element analysis on the origin of red jujube, and to screen the effective indicators to distinguish the origin of red jujube, 34 samples of red jujube were collected from Xinjiang, Hebei, Shanxi and Gansu provinces of China. The contents of Na, Mg, K, Ca, P, B, Al, Ti, Mn, Fe, Co, Ni, Cu, Zn, As, Se, Sr, Mo, Ba, Tl, Ge, Zr, Li, Rb, Cs, La, Ce and Nd in the samples of red jujube were determined by inductively coupled plasma mass spectrometer and analyzed by variance analysis, principal component analysis (PCA), clustering analysis (CA) and discriminant analysis (DA). The results demonstrated that the content of mineral elements in red jujube from different regions has its own characteristics. The average contents of Na and Ge in red jujube were the highest from Xinjiang province, while the average contents of Co, Cu, Zn, Se, Ba and Cs were the lowest. The average contents of Ca, Ba and Ti in red jujube in Hebei province were the highest, the average contents of K, Mn and Rb in red jujube in Shanxi province were the highest, and the average contents of Mg, P, Al, B, Ti, Fe and Cu in Gansu province were the highest. The content of Na in Xinjiang province was three times more than that of Gansu province, and the content of Rb in Hebei province was four times more than that of Xinjiang province. PCA explained 82.1% of total variation, indicating that it played a vital role in the classification of mineral elements of red jujube. Red jujube was divided into five groups at a cluster distance of 9.0, indicating that clustering analysis has achieved ideal results in the origin traceability of red jujube. By discriminant analysis, the correct discriminant rate of 100% was established for samples from Xinjiang, Hebei, Shanxi and Gansu provinces. Facts have proved that it is feasible to judge the traceability of the origin of red jujube by using multi-element analysis.
Key words: red jujube, origin, multi-element analysis, inductively coupled plasma mass spectrometer
*Corresponding Authors: Yumiao Lang and Xiaoxi Yang, Key Laboratory of Public Health Safety of Hebei Province, College of Public Health, Hebei University, Baoding, 071002, China. Emails: [email protected] and [email protected]; Pengsha Bian, Hebei Key laboratory of Mineral Resources and Ecological Environment Monitoring, Hebei Research Center for Geoanalysis, Baoding 071002, China. Email: [email protected]
Received: 22 June 2022; Accepted: 26 August 2022; Published: 7 November 2022
© 2022 Codon Publications
This is an Open Access article distributed under the terms of the Creative Commons Attribution-NonCommercial-ShareAlike 4.0 International (CC BY-NC-SA 4.0). License (http://creativecommons.org/licenses/by-nc-sa/4.0/)
Introduction
With the rapid development of economy and improvement in material living standards, people’s demands for food are more diversified. However, fake and shoddy products have emerged in an endless stream, and food safety has been always the focus of public attention (Fung et al., 2018). Fake and shoddy geographical landmark products have flooded the market, with a negative impact on the reputation of branded products. When a food safety accident occurs, it is necessary to trace food source and establish a food traceability system to ensure good quality of agricultural products (Dehua and Zhongxin, 2019).
According to the International Organization for Standardization, traceability is defined as “the ability to trace the history, use, or location of an entity by a recorded identification” (Cruz Introini et al., 2018). Food traceability can be achieved by analyzing food indicators, including isotope content and ratio, mineral element content, nutrient composition, animal genetic map, microbial map, sensory characteristics, and volatile components (Qie et al., 2021). Alcantara et al. (2021) used principal component analysis (PCA) to show the difference between traditional and specialty coffee by taking advantage of the volatile and nonvola-tile compounds contained in coffee beans. Rana et al. (2021) used linear discriminant analysis (LDA) to study the effects of three sweeteners on the sensory properties of sweeteners in soy milk yogurt, and the sensory properties were determined to distinguish the presence of artificial sweeteners and other sweeteners in a sample with 100% accuracy. Otherwise, modern information technology, including Near-Field Communication (NFC) technology, Internet of things (IoT) technology, blockchain technology, and 5G technology, were used to trace agricultural products. Physical methods are mainly label traceability technology, such as bar code and electronic tag, to dynamically track and monitor the location of agricultural products. Biological methods, including iris signature technology and DNA tracing technology, were used for tracing research. Chemical methods, including stable isotope traceability technology, mineral element traceability technology and organic component fingerprint analysis technology, were used for tracing research. Zhao et al. (2021) summarized recent advances in stable isotope technology in animal products such as beef, lamb, poultry, pork, cheese, milk and seafood. Zhao et al. (2020) used stable isotope ratio determination, mineral element tracing, and organic component fingerprinting to trace meat products and establish a more efficient food traceability system. Many analytical instruments, such as gas chromatography (GC), high-performance liquid chromatography (HPLC), inductively coupled plasma mass spectrometer (ICP-MS), near-infrared spectroscopy (NIR), and isotope ratio mass spectrometer (IRMS), were used to identify the origin of agricultural products. ICP-MS has the advantages of fast analysis speed, low detection limit, and rapid simultaneous determination of various mineral elements.
The mineral fingerprint of agricultural products is closely related to the planting soil substrate background and fertilization history, and is the “natural” basis for tracing origins. The feasibility of mineral element analysis to trace origin has been widely used in dairy products, honey and meat products. Multi-element analysis was used to trace the origin of dairy products. Herman-lara et al. (2019) analyzed the mineral elements of artisanal goat cheese in Veracruz, Mexico, using discriminant analysis, and identified the geographical origin of goat cheese using nine elements. Liu et al. (2019) collected the contents of 11 elements in goat milk and soil from nine farms in three provinces of China and showed that the other variables in goat milk, except zinc content, were significantly different in three regions.
The feasibility of multi-element analysis for traceability of honey origin has also been used widely used. Liu et al. (2021) determined 67 honey s varieties from plant sources, 17 honey varieties from syrups, and 61 adulterated honey varieties. Using stoichiometric analysis, the classification accuracy was more than 93%, indicating that chemical analysis of mineral elements can be used as a reliable tool to distinguish adulterated honey from pure honey. Voica et al. (2020) studied the concentration range of 18 elements in four varieties of honey from Romania. ICP-Q-MS was used to identify different honey samples by principal component analysis (PCA).
There are many feasibility applications for multi-element analysis to trace the origin of meat. Qi et al. (2021) collected the content distribution of pork characteristic elements from seven regions of the country. By comparing various machine learning algorithms, the overall accuracy of feed forward neural network reached 95.71%, which proved that mineral element analysis assisted by machine learning could be used to distinguish pork samples in a country. Wang et al. (2021) measured the elemental data of 104 sheep and 24 goats in Inner Mongolia, and the LDA results showed that the original classification accuracy was 95.2%, so the multi-element analysis method could be used as a method to identify small area mutton.
In China, red jujube is a plum jujube genus plant, known as “eclipse three jujube, immortality” (Rashwan et al., 2020). Red jujube fruit has high nutritional value, and it contains minerals, proteins, vitamins, amino acids, organic acids and polysaccharides (Liao et al., 2022; Niu et al., 2021; Zhou et al., 2021). It also contains a variety of biologically active compounds, such as the phenolic compounds, which have antioxidant and anti-cancer effects. Red jujube also has therapeutic effects on ulcer, hypotension, kidney disease, immune stimulation, fungal and bacterial infection, and other diseases (Liu et al., 2021). However, the complex climatic conditions and different elevations in China may lead to differences in mineral elements content of red jujube in different regions (Wang et al., 2018). Suitable temperature, precipitation and humidity are beneficial to increase the content of mineral elements in red jujube, while sand-storm, freezing damage, rainstorm, diseases and insect pests are not conducive to the increase of mineral elements. At present, red jujube has become a pillar to the industry and an important economic source in many regions. Traceability research on red jujube samples is of great significance for food safety, and can promote healthy economic development of the red jujube industry. However, few studies are available on the origin of red jujube. Therefore, the aim of this study was to identify the origin of red jujube by tracing mineral source information in order to guarantee food safety and quality, and satisfy the rights and interests of consumers.
Methods
Sample collection
Samples of 13 varieties and 34 producing areas from four provinces of China (Xinjiang, Hebei, Shanxi and Gansu Provinces) were collected, numbered, and the sample collection information was recorded (Table 1). For each sample, 200 g of fresh red jujube fruits was collected and stored in a refrigerator at -18°C for later use. Climatic conditions of the four mentioned provinces are shown in Table 2 (Zhao, 2020).
Table 1. Names and codes of 34 red jujube cultivars.
| Abbreviation | Full name | Code |
|---|---|---|
| XJHT | Xinjianghetian | 3 |
| XJAKS | Xinjiangakesu | 2 |
| XJKS | Xinjiangkashi | 2 |
| HBCZ | Hebeicangzhou | 3 |
| HBZH | Hebeizanhuang | 3 |
| HBFP | Hebeifuping | 3 |
| HBTS | Hebeixingtang | 3 |
| SXJS | Shanxijishan | 3 |
| SXJZ | Shanxijinzhong | 2 |
| SXLL | Shanxilvliang | 2 |
| GSLZ | Gansulinze | 3 |
| GSXB | Gansuxuebai | 2 |
| GSDH | Gansudunhuang | 3 |
Table 2. Climatic conditions of four provinces.
| Xinjiang province | Hebei province | Shanxi province | Gansu province | |
|---|---|---|---|---|
| GPS | 73°40’E–96°23’E 34°22’N–49°10’N |
113°04’E–119°53’E 36°01’N–42°37’N |
110°15’E–114°32’E 34°36’N-40°44’N |
10°26’E 32°31’N–42°57’N |
| Altitude (m) | 4,385 | 1,500 | 1,000 | 2,158 |
| Average annual precipitation (mm) | 199.6 | 546.7 | 547.1 | 506.5 |
| Average annual temperature (°C) | 8.7 | 15 | 12 | 9.2 |
Instruments
The following instruments were acquired: 7700 X inductively coupled plasma mass spectrometer (Agilent, USA); Mars-6 closed microwave digestion instrument (CEM Corporation, NC, USA, with the highest temperature of 300°C, and the highest pressure of 10.34 MPa) and Z0049 acid driver (Beijing East Hangke Instrument Co. Ltd., China) (Table 3).
Table 3. Instruments and vendors.
| Instrument | Vendor |
|---|---|
| 7700 X inductively coupled plasma mass spectrometer | Agilent, USA |
| Mars-6 closed microwave digestion instrument | CEM Corporation, NC, USA |
| Z0049 acid driver | Beijing East Hangke Instrument Co. Ltd., China |
Test Methods
Pretreatment of samples
Red jujube were cored and freeze-dried, then grounded to powder with liquid nitrogen, and cryopreserved at -18°C. The frozen samples were taken for mineral element content analysis.
Separation of mineral elements
Red jujube sample, 0.1 g (accurate to 0.0001 g), dried at 105°C for 1 h, was weighed and placed in high-pressure microwave digestion pot, and 7.0-mL mixed acid was added to it. The sample was digested by high-pressure microwave according to the steps given in Table 4. After cooling, the sample was removed and placed in acid drive instrument at 140°C until the solution was dried up. Further, 4.0-mL and 2.0-mL nitric acid (HNO3) was added in two separate steps to drive the acid until 0.05-mL solution and 5.0-mL 20% HNO3 solution (volume fraction, same given below) was extracted, and the solution was transferred to a 50-mL plastic volumetric flask with set volume of water until testing. The whole process of sample analysis was carried out by blank test, and the test was carried out under the instrument condition selected by ICP-MS (Guo and Zhou, 2018).
Table 4. Working procedure of microwave digestion.
| Step | Time (min) | Temperature (°C) |
|---|---|---|
| 1 | 5 (Heat up) | 120 |
| 5 (Heat preservation) | 120 | |
| 2 | 5 (Heat up) | 150 |
| 10 (Heat preservation) | 150 | |
| 3 | 10 (Heat up) | 190 |
| 20 (Heat preservation) | 190 |
The working conditions of ICP-MS are as follows: radio frequency (RF) power rate 1,300 W; carrier gas flow rate 0.85 L•min-1; peristaltic pump flow rate 0.3 RPS and atomization chamber temperature 2°C. The specific working conditions are shown in Table 5.
Table 5. Working parameters of ICP-MS.
| Parameter | Set value | Parameter | Set value |
|---|---|---|---|
| RF power (W) | 1,300 | Repeat the number | 3 |
| Sampling depth (mm) | 7.0 | Integration time (s) | 0.10 |
| Sample lifting speed (RPS) | 0.3 | Sampling cone type | Ni |
| Atomization chamber temperature (°C) | 2.0 | Type of atomizer | High salt |
| Cooling water flow rate (L/min) | 1.2 | Cooling water temperature (°C) | 18 |
| Take the lens 1 (V) | -0.50 | Omega deflection voltage (V) | -70 |
| Extract lens 2 (V) | -155 | Omega lens voltage (V) | 5.2 |
| Dilution gas (Ar) flow rate (L/min) | 0.30 | Carrier gas flow rate (L/min) | 0.85 |
Statistical analysis
SPSS 24.0 software was used to perform variance analysis, clustering analysis (CA), PCA and discriminant analysis of mineral element contents of red jujube.
Result and Discussion
Mineral element results in different regions of red jujube
A total of 27 mineral elements were measured, the results showed that there were significant differences between regions concerning the following 21 elements: Na, K, Mg, Ca, P, B, Mn, Fe, Co, Ni, Cu, Zn, As, Se, Sr, Mo, Ba, Tl, Ge, Li and Rb (Tables 6 and 7). The mineral element contents of red jujube in different regions had their own characteristics. In Xinjiang province, the average contents of Na and Ge in red jujube were the highest, while the average contents of Co, Cu, Zn, Se, Ba and Cs were the lowest. In Hebei province, the average contents of Ca, Ba and Ti in red jujube were the highest, while the average contents of As, Mo and Li were the lowest. In Shanxi province, the average contents of K, Mn and Rb in red jujube were the highest, while the average content of Ni was the lowest. In Gansu province, the average contents of Mg, P, Al, B, Ti, Fe and Cu in red jujube were the highest, while the average contents of Zr and La were the lowest. The Na content of red jujube in Xinjiang province was three times more than that in Gansu province; the Ni content of red jujube in Gansu province was two times more than that in Xinjiang province; the Ba content of red jujube in Hebei province was two times more than that in Xinjiang province; and the Rb content of red jujube in Hebei province was four times more than that in Xinjiang province.
Table 6. Contents of 27 elements in red jujube from different areas.
| Element (mg/100 g) | XJHT | XJAKS | XJKS | HBCZ | HBZH | HBFP |
|---|---|---|---|---|---|---|
| Na | 153 ± 53c,d | 134 ± 63b,c,d | 142 ± 60b,c,d | 315 ± 127e | 141 ± 21b,c,d | 45 ± 60a,b |
| Mg | 313 ± 12a,b,c | 299 ± 13a,b,c | 322 ± 18a,b,c,d | 364 ± 28d,e,f | 322 ± 24a,b,c,d | 295 ± 7a,b |
| K | 8223 ± 828b,c,d,e | 6409 ± 247a | 6952 ± 449a,b,c | 7190 ± 426a,b,c | 8296 ± 108c,d,e | 6751 ± 1425a,b |
| Ca | 466 ± 110a,b,c | 452 ± 48a,b,c | 572 ± 54b,c,d | 547 ± 44a,b,c | 406 ± 63a,b | 677 ± 228c,d |
| P | 793 ± 92a,b,c,d | 699 ± 121a,b | 742 ± 54a,b,c | 740 ± 18a,b,c | 812 ± 139a,b,c,d | 672 ± 185a |
| B | 14.09 ± 1.13c | 8.99 ± 2.23a | 11.00 ± 3.38a,b,c | 12.47 ± 1.80a,b,c | 13.92 ± 1.02b,c | 11.92 ± 1.53a,b,c |
| Al | 6.39 ± 1.30a | 5.06 ± 1.40a | 5.65 ± 3.08a | 7.28 ± 2.09a | 5.19 ± 0.39a | 10.55 ± 9.69a |
| Ti | 0.55 ± 0.07a | 0.39 ± 0.07a | 0.37 ± 0.08a | 0.47 ± 0.04a | 0.41 ± 0.05a | 0.54 ± 0.35a |
| Mn | 2.99 ± 0.28a,b,c,d | 1.97 ± 0.40a | 1.97 ± 0.26a | 2.24 ± 0.21a,b | 2.44 ± 0.40a,b,c | 3.49 ± 0.61c,d |
| Fe | 8.80 ± 1.49a,b,c,d | 7.46 ± 1.38a,b | 7.19 ± 1.15a | 8.32 ± 0.61a,b,c,d | 8.17 ± 0.56a,b,c | 11.86 ± 5.36c,d |
| Co | 0.003 ± 0.00a | 0.003 ± 0.00a | 0.003 ± 0.00a | 0.004 ± 0.00a | 0.003 ± 0.00a | 0.019 ± 0.01c |
| Ni | 0.15 ± 0.08a | 0.16 ± 0.12a | 0.20 ± 0.12a,b | 0.19 ± 0.03a | 0.18 ± 0.06a | 0.40 ± 0.19d |
| Cu | 1.69 ± 0.30a,b | 1.39 ± 0.57a | 1.65 ± 0.48a,b | 1.58 ± 0.21a,b | 1.71 ± 0.22a,b | 1.97 ± 0.34a,b,c |
| Zn | 3.72 ± 0.17a,b,c | 3.51 ± 0.53a,b,c | 4.05 ± 1.54b,c,d | 3.53 ± 0.57a,b,c | 3.45 ± 1.06a,b,c | 4.84 ± 0.65c,d,e |
| As | 0.01 ± 0.00a,b,c | 0.009 ± 0.00a,b | 0.008 ± 0.00a,b | 0.01 ± 0.00a,b,c | 0.01 ± 0.01b,c | 0.006 ± 0.00a |
| Se | 0.02 ± 0.00a,b | 0.02 ± 0.01a | 0.02 ± 0.00a,b | 0.03 ± 0.00a,b,c | 0.02 ± 0.01a,b | 0.03 ± 0.01a,b,c |
| Sr | 7.43 ± 3.34a,b,c,d | 6.90 ± 0.57a,b,c,d | 9.46 ± 4.50c,d | 8.47 ± 1.23b,c,d | 6.70 ± 3.16a,b,c,d | 3.88 ± 1.70a,b |
| Mo | 0.06 ± 0.02b,c,d | 0.04 ± 0.01a,b,c,d | 0.03 ± 0.01a,b | 0.03 ± 0.01a,b | 0.05 ± 0.01a,b,c,d | 0.04 ± 0.02a,b,c |
| Ba | 0.15 ± 0.01a,b | 0.22 ± 0.00a,b,c | 0.18 ± 0.08a,b,c | 0.20 ± 0.06a,b,c | 0.11 ± 0.02a | 0.71 ± 0.52d |
| Tl | 0.001 ± 0 .00a | 0.001 ± 0.00a | 0.00 ± 0.00a | 0.00 ± 0.00a | 0.00 ± 0.00a | 0.02 ± 0.02b |
| Ge | 0.003 ± 0.00a,b,c,d | 0.003 ± 0.00a,b,c,d,e | 0.002 ± 0.00a | 0.003 ± 0.00a,b,c,d,e | 0.004 ± 0.00 e | 0.003 ± 0.00a,b,c,d,e |
| Zr | 0.01 ± 0.01a | 0.01 ± 0.00a | 0.008 ± 0.00a | 0.01 ± 0.01a | 0.007 ± 0.00a | 0.009 ± 0.00a |
| Li | 0.64 ± 0.19b,c | 0.33 ± 0.05a,b | 0.45 ± 0.32a,b,c | 0.67 ± 0.27b,c | 0.57 ± 0.10b,c | 0.17 ± 0.23c |
| Rb | 2.83 ± 1.02a | 2.02 ± 1.34a | 1.26 ± 0.63a | 2.05 ± 0.76a | 1.32 ± 0.19a | 14.42 ± 11.17b |
| Cs | 0.003 ± 0.00a | 0.004 ± 0.00a | 0.002 ± 0.00a | 0.009 ± 0.01a | 0.001 ± 0 .00a | 0.17 ± 0.19a |
| La | 0.02 ± 0.03a | 0.005 ± 0.00a | 0.003 ± 0.00a | 0.004 ± 0.00a | 0.006 ± 0.00a | 0.009 ± 0.00a |
| Ce | 0.039 ± 0.05a | 0.013 ± 0.01a | 0.006 ± 0.00a | 0.007 ± 0.00a | 0.008 ± 0.00a | 0.012 ± 0.01a |
*Different letters after the given data in the same row show significant differences (P < 0.05).
Table 7. Contents of 27 elements in red jujube from different areas.
| HBTS | SXJS | SXJZ | SXLL | GSLZ | GSXB | GSDH | |
|---|---|---|---|---|---|---|---|
| Na (mg/100 g) | 14 ± 6a | 34 ± 21a,b | 80 ± 24 a,b,c,d | 181 ± 10d | 35 ± 3a,b | 74 ± 55a,b,c | 45 ± 7a,b |
| Mg (mg/100 g) | 288 ± 59a | 397 ± 12f | 341 ± 8b,c,d,e | 347 ± 9c,d,e | 306 ± 13a,b,c | 374 ± 20e,f | 458 ± 23g |
| K (mg/100 g) | 6893 ± 1154a,b,c | 8090 ± 690b,c,d,e | 9254 ± 326e | 9482 ± 421e | 7520 ± 394a,b,c,d | 8984 ± 423d,e | 8692 ± 714d,e |
| Ca (mg/100 g) | 678 ± 216c,d | 791 ± 89d | 405 ± 91a,b | 322 ± 53a | 527 ± 109a,b,c | 535 ± 18a,b,c | 616 ± 67b,c,d |
| P (mg/100 g) | 607 ± 146a | 735 ± 34a,b,c | 1011 ± 84c,d | 1080 ± 135d | 618 ± 40a | 767 ± 204a,b,c | 983 ± 313d |
| B (mg/100 g) | 11.00 ± 2.02a,b,c | 9.22 ± 0.72a | 14.22 ± 1.23c | 18.47 ± 3.66d | 9.95 ± 1.34a,b | 11.13 ± 4.33a,b,c | 18.71 ± 1.23d |
| Al (mg/100 g) | 5.39 ± 1.21a | 7.05 ± 1.57a | 7.14 ± 1.00a | 8.51 ± 0.94a | 10.93 ± 2.43a | 9.72 ± 4.34a | 8.00 ± 2.15a |
| Ti (mg/100 g) | 0.56 ± 0.15a | 0.54 ± 0.11a | 0.60 ± 0.08a | 0.60 ± 0.05a | 0.59 ± 0.20a | 0.55 ± 0.27a | 0.66 ± 0.08a |
| Mn (mg/100 g) | 3.22 ± 1.34b,c,d | 3.32 ± 0.27b,c,d | 3.70 ± 0.42d | 2.36 ± 0.65a,b,c | 2.58 ± 0.29a,b,c,d | 2.63 ± 0.66a,b,c,d | 3.09 ± 0.04a,b,c,d |
| Fe (mg/100 g) | 10.36 ± 1.23a,b,c,d | 10.76 ± 0.29a,b,c,d | 10.95 ± 1.16a,b,c,d | 10.47 ± 0.66a,b,c,d | 12.58 ± 1.11d | 9.99 ± 1.85a,b,c,d | 11.68 ± 2.84b,c,d |
| Co (mg/100 g) | 0.016 ± 0.01b,c | 0.006 ± 0.00a | 0.003 ± 0.00a | 0.002 ± 0 .00a | 0.005 ± 0.00a | 0.003 ± 0.00a | 0.007 ± 0.00a,b |
| Ni (mg/100 g) | 0.38 ± 0.16b,c | 0.12 ± 0.03a | 0.13 ± 0.03a | 0.09 ± 0.02a | 0.36 ± 0.03b,c | 0.36 ± 0.04a | 0.36 ± 0.05b,c |
| Cu (mg/100 g) | 2.23 ± 0.69b,c | 1.89 ± 0.18a,b,c | 2.05 ± 0.28a,b,c | 1.50 ± 0.50a,b | 1.55 ± 0.09a,b | 1.42 ± 0.47a,c | 2.54 ± 0.13a,c |
| Zn (mg/100 g) | 5.32 ± 1.20d,e | 6.40 ± 0.78e | 3.57 ± 0.76a | 2.30 ± 0.29a,b,c | 3.10 ± 0.33a,b | 3.18 ± 0.14a,b,c | 6.10 ± 1.18e |
| As (mg/100 g) | 0.006 ± 0.00a | 0.007 ± 0.00a,b | 0.01 ± 0.00b,c | 0.02 ± 0.01c | 0.009 ± 0.00a,b | 0.01 ± 0.00a,b,c | 0.01 ± 0.00a,b,c |
| Se (mg/100 g) | 0.02 ± 0.01a,b,c | 0.03 ± 0.01b,c | 0.03 ± 0.01a,b,c | 0.02 ± 0.01a,b | 0.02 ± 0.00a,b,c | 0.03 ± 0.00a,b,c | 0.04 ± 0.01c |
| Sr (mg/100 g) | 3.24 ± 1.44a | 6.95 ± 2.14a,b,c,d | 5.52 ± 2.89a,b,c,d | 4.64 ± 1.18a,b,c | 4.65 ± 0.75a,b,c | 7.80 ± 2.56a,b,c,d | 9.70 ± 1.66d |
| Mo (mg/100 g) | 0.03 ± 0.02a | 0.07 ± 0.02c,d | 0.07 ± 0.02d,e | 0.09 ± 0.01e | 0.04 ± 0.00a,b,c | 0.06 ± 0.01a,b,c,d | 0.04 ± 0.00a,b,c,d |
| Ba (mg/100 g) | 0.58 ± 0.40c,d | 0.54 ± 0.05b,c,d | 0.14 ± 0.02a,b | 0.12 ± 0.02a,b | 0.26 ± 0.06a,b,c | 0.17 ± 0.06a,b,c | 0.23 ± 0.01a,b,c |
| Tl (mg/100 g) | 0.02 ± 0.01b | 0.004 ± 0.00a | 0.00 ± 0.00a | 0.001 ± 0.00a | 0.001 ± 0.00a | 0.00 ± 0.00a | 0.00 ± 0.00a |
| Ge (mg/100 g) | 0.003 ± 0 .00a,b,c,d | 0.002 ± 0 .00a,b,c | 0.003 ± 0.00a,b,c,d,e | 0.003 ± 0.00d,e | 0.003 ± 0.00c,d,e | 0.002 ± 0 .00a,b | 0.003 ± 0.00b,c,d,e |
| Zr (mg/100 g) | 0.008 ± 0.00a | 0.01 ± 0.00a | 0.01 ± 0.00a | 0.01 ± 0.01a | 0.02 ± 0.00a | 0.02 ± 0.00a | 0.01 ± 0.01a |
| Li (mg/100 g) | 0.07 ± 0.08c | 0.43 ± 0.26a,b,c | 0.45 ± 0.24a,b,c | 0.84 ± 0.30c | 0.09 ± 0.01a | 0.33 ± 0.22a,b | 0.84 ± 0.07c |
| Rb (mg/100 g) | 15.10 ± 12.38b | 5.07 ± 1.45a | 2.37 ± 0.59a | 2.76 ± 0.38a | 4.48 ± 0.33a | 1.74 ± 0.64a | 2.18 ± 0.27a |
| Cs (mg/100 g) | 0.05 ± 0.05a | 0.02 ± 0.00a | 0.003 ± 0.00a | 0.003 ± 0.00a | 0.01 ± 0.00a | 0.002 ± 0.00a | 0.002 ± 0.00a |
| La (mg/100 g) | 0.009 ± 0.01a | 0.005 ± 0.00a | 0.004 ± 0.00a | 0.004 ± 0.00a | 0.004 ± 0.00a | 0.005 ± 0.00a | 0.004 ± 0.00a |
| Ce (mg/100 g) | 0.011 ± 0.01a | 0.009 ± 0.00a | 0.008 ± 0.00a | 0.009 ± 0.01a | 0.008 ± 0.00a | 0.009 ± 0.01a | 0.007 ± 0.00a |
*Different letters after the given data in the same row show significant differences (P < 0.05).
Wang et al. (2018) analyzed reducing sugars, organic acids, and minerals from 15 red jujube cultivars. After comparison, the Ti and Ni contents of most red jujube varieties in this study were similar to the results of Wang et al (Wang et al., 2018), and the Al content of all varieties was lower than that of Wang et al (Wang et al., 2018). The content of element B in all red jujube varieties was higher than the results of Wang et al (Wang et al., 2018). Nadeem et al. (2019) analyzed the mineral elements of 21 jujube cultivars. In the results of this study, the contents of K, Fe, Ca, Na, Mg, Zn and Cu of all red jujube varieties were higher than the results of the study conducted by Nadeem et al (2019). The differences of mineral elements of red jujube could have a close relationship with the differences of soil types and main mineral elements present in the soil of different areas of red jujube. According to a conducted research, soil in Xinjiang province was mainly calcium soil, desert soil, meadow soil, and swamp soil (Li et al., 2021). In Hebei province, the soil type was tidal soil (Yao et al., 2019). The main soil type in Shanxi province was cinnamon soil (Ji et al., 2021), and that in Gansu province was gray brown desert soil (Chen et al., 2019). The contents of heavy metals in red jujube from Hebei and Shanxi provinces were higher than that from Xinjiang province. This could be due to the fact that Hebei and Shanxi provinces are located in the central plains where the production method is mainly heavy industry; therefore, it has a negative impact on the environment of agricultural production.
Principal component analysis
The PCA (Table 8) of 21 mineral elements was performed with significant differences between the red jujube, with five principal components having eigenvalues of more than 1, which accounted for 82.1% of total variance. The first principal component mainly explained the content information of eight elements, such as Ba, Co, Ti, Rb, Ca, Ni, Mn and Zn, while the second principal component mainly integrated the content information of six elements, such as K, P, Mg, Cu, B and Se. The third principal component mainly integrated the content information of As and Sr in the sample; the fourth principal component mainly represented the content information of Li and Na, and the fifth and final principal component mainly represented the content information of Ge.
Table 8. The eigenvector and cumulative variance contribution rate of each variable in the first five principal components.
| Component | 1 | 2 | 3 | 4 | 5 |
|---|---|---|---|---|---|
| Ba | 0.928 | 0.099 | 0.100 | 0.034 | -0.131 |
| Co | 0.920 | 0.131 | 0.220 | 0.223 | -0.060 |
| Tl | 0.907 | 0.051 | 0.264 | 0.188 | -0.177 |
| Rb | 0.901 | 0.074 | 0.269 | 0.184 | -0.170 |
| Ca | 0.781 | 0.291 | -0.330 | -0.049 | -0.133 |
| Ni | 0.748 | 0.196 | 0.024 | 0.316 | 0.343 |
| As | -0.704 | 0.232 | 0.413 | 0.192 | -0.084 |
| Li | -0.670 | 0.486 | -0.117 | 0.402 | -0.100 |
| K | -0.610 | 0.565 | 0.294 | -0.293 | -0.034 |
| P | -0.571 | 0.546 | 0.436 | 0.053 | -0.097 |
| Mo | -0.477 | 0.402 | 0.186 | -0.451 | -0.407 |
| Mg | -0.186 | 0.798 | -0.297 | -0.067 | 0.236 |
| Cu | 0.356 | 0.762 | 0.044 | 0.217 | 0.048 |
| B | -0.389 | 0.682 | 0.303 | 0.405 | 0.055 |
| Se | 0.092 | 0.627 | -0.416 | -0.141 | 0.227 |
| Mn | 0.527 | 0.572 | 0.304 | -0.179 | -0.328 |
| Zn | 0.568 | 0.57 | -0.468 | -0.041 | 0.040 |
| Sr | -0.400 | 0.285 | -0.701 | 0.089 | 0.046 |
| Ge | -0.139 | -0.112 | 0.614 | 0.062 | 0.587 |
| Na | -0.573 | -0.176 | -0.104 | 0.608 | -0.158 |
| Fe | 0.345 | 0.276 | 0.368 | -0.404 | 0.373 |
| Variance contribution rate | 37.758 | 19.798 | 11.841 | 7.266 | 5.435 |
| Cumulative contribution rate | 37.758 | 57.556 | 69.398 | 76.663 | 82.098 |
Zhang et al. (2021b) studied the fatty acid (FA) content of 21 jujube varieties, and the results showed that seven main components accounted for 82.59% of total variation, and the first two components accounted for 43.01% of data variation. Different fatty acids were well correlated with principal components 1 and 2. Zhang et al. (2021a) evaluated the quality of 37 jujube varieties by titration, ultraviolet spectrophotometry and HPLC, and calculated the comprehensive score of different jujube varieties by PCA, which provided a theoretical basis for plantation and cultivation of red jujube. Yang et al. (2019) used headspace-gas chromatography-ion mobility instrument (HS-GC-IMS) to analyze red jujube during different refrigerated periods. PCA results showed that the method could effectively distinguish fresh jujube from refrigerated jujube. In this study, 21 minerals from 34 red jujube-producing areas were studied, and the five principal components explained 82.1% of total variation. It is observed that PCA was used for quite a number of times previously for food origin traceability, and it provided the information of various elements in the sample more directly through a comprehensive manner.
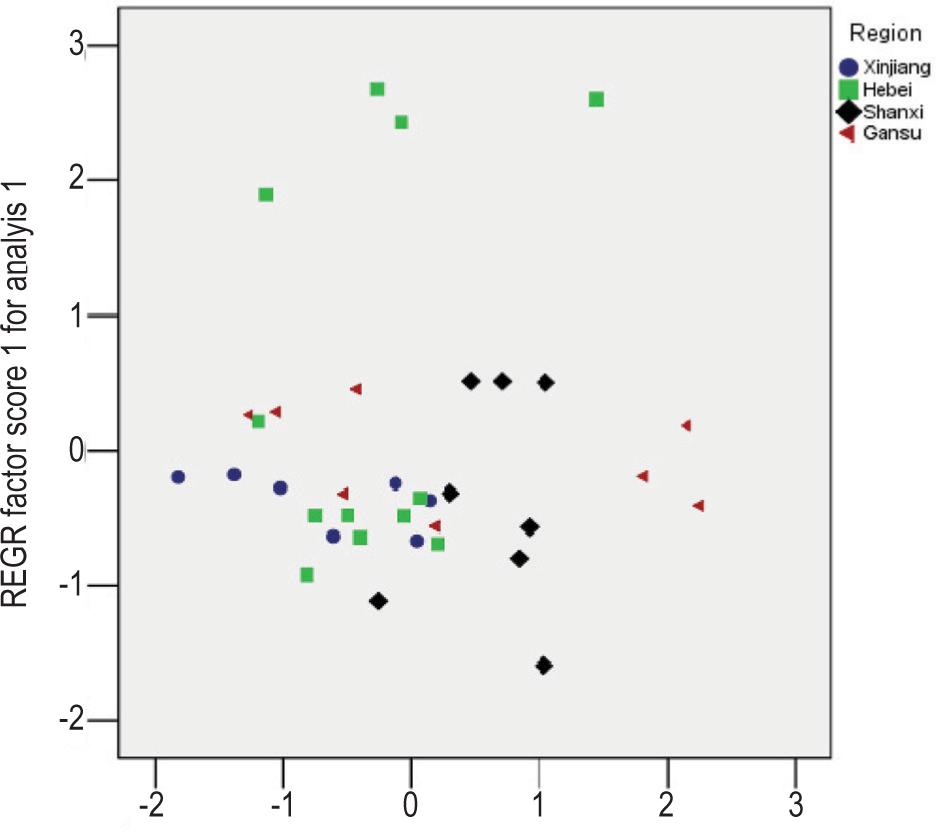
Using the standardized scores of the first and second principal components as a scatter plot (Figure 1), the results showed that Xinjiang, Hebei, Shanxi and Gansu provinces overlapped each other, and neither these could be clearly separated nor could be the origin of red jujube clearly identified.
Figure 1. A scatter plot of the first and second principal components.
In this study, the first two principal components (57.56% of total variation) were used to isolate the source of red jujube; however, they failed to separate. The reason could be the error in experimental results caused by insufficient sample size, or the influence of climatic factors (precipitation, temperature, or humidity) during the season of sample collection. Hence, the sample size of red jujube collection must be expanded in subsequent studies, and multi-dimensional factors of mineral elements in red jujube must be considered.
Clustering analysis
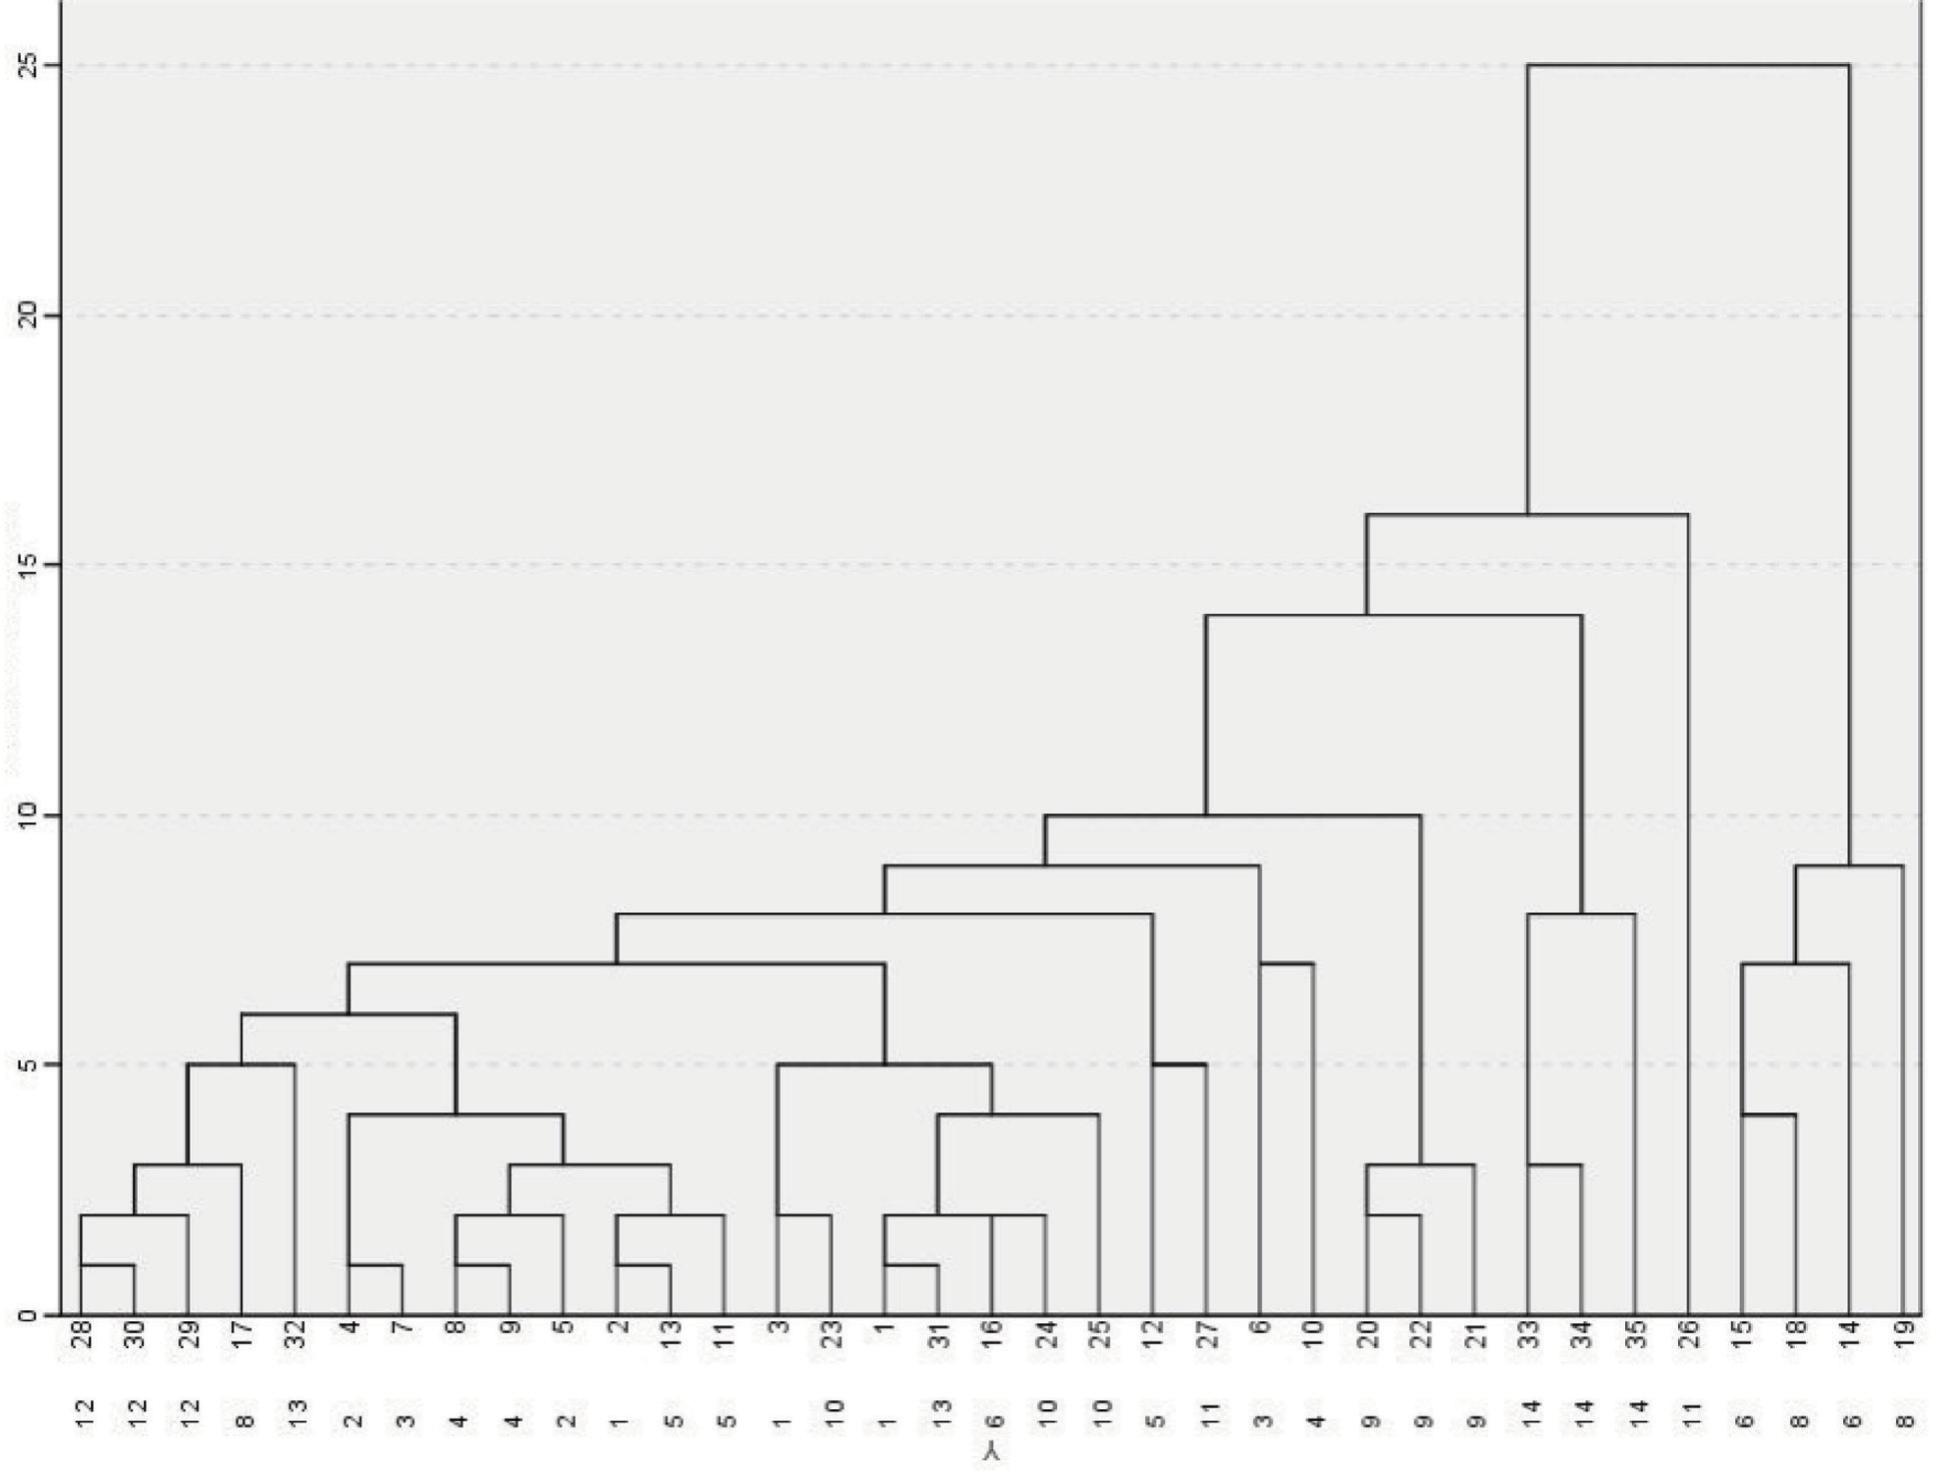
Based on the standardized scores of the first five principal components, clustering analysis was conducted on 13 red jujube samples from producing areas (Figure 2). Basically, the classification of red jujube samples was consistent with the classification of region of origin. By using the method of inter-group connection and the square Euclidean distance as a metric criterion, red jujube samples were divided into five categories on the basis of clustering distance. The first category mainly comprised red jujube samples from Hebei and Xinjiang provinces, including four red jujube samples from Shanxi and Gansu provinces. The second category comprised all samples from Shanxi province; the third category had all samples from Gansu province; the fourth category contained all samples from Shanxi province; and the fifth category had all samples from Hebei province.
Figure 2. Clustering analysis pedigree of red jujube.
In Figure 2, the first column of the ordinate represented the red jujube sample, 1–7 represented Xinjiang province, 8–19 represented Hebei province, 20–26 represented Shanxi province and 27–34 represented Gansu province. The second column of the ordinate represented four regions, 1–3 represented Xinjiang province, 4–8 represented Hebei province, 9–11 represented Shanxi province and 12–14 represented Gansu province. The abscissa represented the distance scale of clustering analysis.
Zhang et al. (2021b) used clustering analysis to distinguish 21 red jujube cultivars according to their composition and content of fatty acids, indicating that different red jujube cultivars could be completely divided from the left, with gradual gathering of relatively similar red jujube cultivars. Therefore, 21 red jujube cultivars could be distinguished according to the composition and content of their fatty acids. Khadivi et al. (2021) used the Euclidean distance method and the Ward method for clustering analysis, and divided jujube germplasm into two main clusters, which provided a basis for the morphological study of red jujube and the development of the fruit processing industry. In this study, red jujube was divided into five groups at a cluster distance of 9.0, indicating that clustering analysis achieved ideal results in the origin traceability of red jujube. The first category was found to have samples from Hebei and Xinjiang provinces, probably because both these regions have cold winters and hot summers. The average temperature of Xinjiang province is lower than that of Hebei province, but the sunshine period in Xinjiang province is more than that of Hebei province. The comprehensive climatic conditions and soil types make the samples of Hebei and Xinjiang provinces belonging to the first category.
Discriminant analysis
The overall correct classification and cross-validation tests were used to categorize red jujube samples from 13 producing areas. The overall correct classification rate of the samples from 13 regions was 100%, which indicated that mineral elements could be used in the discriminant analysis of the origin of red jujube. The discriminant rate of the cross-validation was only 25%. The cross-validation rate of Cangzhou in Hebei province, Linze in Gansu province, and Dunhuang in Gansu province was 33.3%, and the discriminant rate of other regions was 0%. The insufficient number of samples and unrepresentative samples were also important factors affecting the discriminant rate. The similar annual average temperature between Hebei and Shanxi provinces, and Xinjiang and Gansu provinces, and the similar annual average precipitation between Hebei, Shanxi and Gansu provinces could be one of the reasons for poor discriminant performance of cross-discriminant analysis.
Zhang et al. (2021b) used LDA to classify 21 varieties, with good results. A total of 63 samples were collected, and three samples from each of 21 species were classified correctly. Wu et al. (2021) tested 31 quality indicators of red jujube from six regions, screened eight main parameters, and found that both classification accuracy and cross-validation accuracy of LDA were 100%, indicating that LDA could be used as a statistical method to track the origin of red jujube. Qi et al. (2022) used a portable NIR spectrometer to collect the NIR spectra of five varieties of red jujube. The authors used fuzzy-improved LDA (FiLDA) and K-nearest neighbor (KNN) to classify red jujube, with the highest classification accuracy of 94.4%, indicating that FiLDA combined with NIR spectroscopy is an effective method for identifying red jujube. The present study indicates that discriminant analysis could be used to trace the origin of red jujube, and the sample size must be increased in the future experiments to make experimental results more representative and convincing.
Conclusions
The contents of 27 elements in 13 varieties of red jujube from Xinjiang, Hebei, Shanxi and Gansu provinces were determined by ICP-MS. The results showed differences in the mineral elements of samples from different regions. PCA could not effectively distinguish the origin of red jujube, while clustering analysis and discriminant analysis could reliably distinguish the origin of red jujube varieties. In conclusion, it is feasible to classify red jujube from different producing areas on the basis of mineral elements, especially in the field of food traceability and adulteration research where contents of elements vary with food source.
Owing to differences of soil, environment, climate and water quality in different regions, the enrichment degree of elements in different varieties of red jujube is also different, which may be the main reason for differences in elements. A preliminary exploration has demonstrated that multi-element analysis of red jujube traceability is feasible, but the premise of this method is that the sample is large enough and the sample source is highly representative. Therefore, we must continue to expand the scope and numbers of samples in subsequent research, select representative samples, conduct more in-depth analysis, combine element analysis with statistical methods, and establish a method suitable for detection of food traceability.
Acknowledgment
The authors gratefully acknowledge the financial support of Supported by Medical Science Foundation of Hebei University (2021A04), Science and Technology Project of Higher Education in Hebei Province (QN2020240), Postgraduate Innovation Funding Project of Hebei Province (CXZZSS2022010), Innovation and Entrepreneurship Program for College Students of Hebei University (2022350).
REFERENCES
Alcantara, G.M., Dresch, D. and Melchert, W.R., 2021. Use of non-volatile compounds for the classification of specialty and traditional Brazilian coffees using principal component analysis. Food Chemistry 360: 130088. 10.1016/j.foodchem.2021.130088
Chen, S., Shu, X., Tang, H., Mao, X., Xu, C. and Lu, X., 2019. Microwave vitrification of uranium-contaminated soil for nuclear test site and chemical stability. Ceramics International 45(10): 13334–13339. 10.1016/j.ceramint.2019.04.026
Cruz Introini, S., Boza, A. and Alemany Díaz, M.D.M., 2018. Traceability in the food supply chain: review of the literature from a technological perspective. Dirección y Organización 64: 50–55. 10.37610/dyo.v0i64.522
Dehua, H.E. and Zhongxin, S.H.I., 2019. Review on research and application of food safety traceability system. Journal of Agricultural Science and Technology 21(4): 123.
Fung, F., Wang, H.S. and Menon, S., 2018. Food safety in the 21st century. Biomedical Journal 41(2): 88–95. 10.1016/j.bj.2018.03.003
Guo, X.F., Zhou, X.F., Feng, Y.F., Wang, Z.Q. and Cui-Yun, W.U., 2018. Analysis and comprehensive evaluation of the content of mineral elements in different jujube cultivars. Science and Technology of Food Industry 22: 262–269. 10.13386/j.issn1002-0306.2018.22.046
Herman-Lara, E., Bolivar-Moreno, D., Toledo-Lopez, V.M., Cuevas-Glory, L.F., Lope-Navarrete, M.C., Barron-Zambrano, J.A., Cuevas-Glory, L.F., Lope-Navarrete, M.C., Barron-Zambrano, J.A., Díaz-rivera, P. and Ramírez-Rivera, E.D.J., 2019. Minerals multi-element analysis and its relationship with geographical origin of artisanal Mexican goat cheeses. Food Science and Technology 39: 517–525. 10.1590/fst.23918
Ji, H., Ren, R., Chen, J., Zhang, J., Li, A. and Feng, W., 2021. Characteristics of selenium content in different soil types in Guanzhong and its influence on selenium content of corn grain. Northwestern Geology 54(4): 239–249.
Khadivi, A., Mirheidari, F., Moradi, Y. and Paryan, S., 2021. Identification of superior jujube (Ziziphus jujuba Mill.) geno-types based on morphological and fruit characterizations. Food Science & Nutrition 9(6): 3165–3176. 10.1002/fsn3.2276
Li, X., Ding, J., Liu, J., Ge, X. and Zhang, J., 2021. Digital mapping of soil organic carbon using sentinel series data: a case study of the Ebinur lake watershed in Xinjiang. Remote Sensing 13(4): 769. 10.3390/rs13040769
Liao, F., Zhu, Z., Pan, X., Li, B., Zhu, Y., Chen, Y. and Shu, X., 2022. Safety and efficacy of nonoperative treatment in esophageal perforation caused by foreign bodies. Clinical and Translational Gastroenterology 13(1): e00451. 10.14309/ctg.0000000000000451
Liu, T., Ming, K., Wang, W., Qiao, N., Qiu, S., Yi, S., Huang, X. and Luo, L., 2021. Discrimination of honey and syrup-based adulteration by mineral element chemometrics profiling. Food Chemistry 343: 128455. 10.1016/j.foodchem.2020.128455
Liu, H., Zhao, Q., Guo, X., Tang, C., Yu, X., Zhan, T., Qin, Y. and Zhang, J., 2019. Application of isotopic and elemental fingerprints in identifying the geographical origin of goat milk in China. Food Chemistry 277: 448–454. 10.1016/j.foodchem.2018.10.144
Nadeem, M., Qureshi, T.M., Ugulu, I., Riaz, M.N., An, Q.U., Khan, Z.I., Ahmad, K., Ashfaq, A., Bashir, H. and Dogan, Y., 2019. Mineral, vitamin and phenolic contents and sugar profiles of some prominent date palm (Phoenix dactylifera) varieties of Pakistan. Pakistan Journal of Botany 51(1): 171–178. 10.30848/PJB2019-1(14)
Niu, Y., Wei, S., Liu, H., Zang, Y., Cao, Y., Zhu, R., Zang, Y., Cao, Y., Zhu, R., Zheng, X. and Yao, X., 2021. The kinetics of nutritional quality changes during winter jujube slices drying process. Quality Assurance and Safety of Crops & Foods 13(1): 73–82. 10.15586/qas.v13i1.824
Qi, J., Li, Y., Zhang, C., Wang, C., Wang, J., Guo, W. and Wang, S., 2021. Geographic origin discrimination of pork from different Chinese regions using mineral elements analysis assisted by machine learning techniques. Food Chemistry 337: 127779. 10.1016/j.foodchem.2020.127779
Qi, Z., Wu, X., Yang, Y., Wu, B. and Fu, H., 2022. Discrimination of the red jujube varieties using a portable NIR spectrometer and fuzzy improved linear discriminant analysis. Foods 11(5): 763. 10.3390/foods11050763
Qie, M., Zhang, B., Li, Z., Zhao, S. and Zhao, Y., 2021. Data fusion by ratio modulation of stable isotope, multi-element, and fatty acids to improve geographical traceability of lamb. Food Control 120: 107549. 10.1016/j.foodcont.2020.107549
Rana, M.R., Babor, M. and Sabuz, A.A., 2021. Traceability of sweeteners in soy yogurt using linear discriminant analysis of physico-chemical and sensory parameters. Journal of Agriculture and Food Research 5: 100155. 10.1016/j.jafr.2021.100155
Rashwan, A.K., Karim, N., Shishir, M.R.I., Bao, T., Lu, Y. and Chen, W., 2020. Jujube fruit: a potential nutritious fruit for the development of functional food products. Journal of Functional Foods 75: 104205. 10.1016/j.jff.2020.104205
Voica, C., Iordache, A.M. and Ionete, R.E., 2020. Multielemental characterization of honey using inductively coupled plasma mass spectrometry fused with chemometrics. Journal of Mass Spectrometry 55(7): e4512. 10.1002/jms.4512
Wang, L., Fu, H., Wang, W., Wang, Y., Zheng, F., Ni, H. and Chen, F., 2018. Analysis of reducing sugars, organic acids and minerals in 15 cultivars of jujube (Ziziphus jujuba mill.) fruits in China. Journal of Food Composition and Analysis 73: 10–16. 10.1016/j.jfca.2018.07.008
Wang, Q., Liu, H., Zhao, S., Qie, M., Bai, Y., Zhang, J., Guo, J. and Zhao, Y., 2021. Discrimination of mutton from different sources (regions, feeding patterns and species) by mineral elements in Inner Mongolia, China. Meat Science 174: 108415. 10.1016/j.meatsci.2020.108415
Wu, L., Li, L., Zhang, G., Jiang, N., Ouyang, X. and Wang, M., 2021. Geographical and varietal traceability of Chinese jujubes based on physical and nutritional characteristics. Foods 10(10): 2270. 10.3390/foods10102270
Yang, L., Liu, J., Wang, X., Wang, R., Ren, F., Zhang, Q., Shan, Y. and Ding, S., 2019. Characterization of volatile component changes in jujube fruits during cold storage by using headspace-gas chromatography-ion mobility spectrometry. Molecules 24(21): 3904. 10.3390/molecules24213904
Yao, X., Yang, W., Li, M., Zhou, P. and Liu, Z., 2019. Prediction of total nitrogen content in different soil types based on spectroscopy. IFAC-Papers Online 52(30): 270–276. 10.1016/j.ifacol.2019.12.533
Zhang, Y., Sun, X., Vidyarthi, S.K. and Zhang, R., 2021a. Active components and antioxidant activity of thirty-seven varieties of Chinese jujube fruits (Ziziphus jujuba Mill.). International Journal of Food Properties 24(1): 1479–1494. 10.1080/10942912.2021.1977656
Zhang, R., Sun, X., Zhang, K., Zhang, Y., Song, Y. and Wang, F., 2021b. Fatty acid composition of 21 cultivars of Chinese jujube fruits (Ziziphus jujuba Mill.). Journal of Food Measurement and Characterization 15(2): 1225–1240. 10.1007/s11694-020-00718-4
Zhao, W., 2020. Extreme weather and climate events in China under changing climate. National Science Review 7(5): 938–943. 10.1093/nsr/nwaa069
Zhao, J., Li, A., Jin, X. and Pan, L., 2020. Technologies in individual animal identification and meat products traceability. Biotechnology & Biotechnological Equipment 34(1): 48–57. 10.1080/13102818.2019.1711185
Zhao, S., Liu, H., Qie, M., Zhang, J., Tan, L. and Zhao, Y., 2021. Stable isotope analysis for authenticity and traceability in food of animal origin. Food Reviews International: 1–21. 10.1080/87559129.2021.2005087
Zhou, Y., Hao, L., Ji, C., Zhou, Q., Song, X., Liu, Y., Li, H., Li, C., Gao, Q., Li, J., Zhang, P. and Liu, X., 2021. The effect of salt-tolerant antagonistic bacteria CZ-6 on the rhizosphere microbial community of winter jujube (Ziziphus jujuba Mill. “Dongzao”) in saline-alkali land. Biomed Research International. 10.1155/2021/5171086