
Download

Hue angle = Tan − 1 b * a * Hue angle = 360 + Tan − 1 b * a * 1 Chroma = a * 2 + b * 2 2 Total anthocyanins m g L ' M E = A*MW*DF*10 3 ε * 1 , 4 Antioxidant power % inhibition = A Blank t = 6 − A samples or standards t = 6 a ABTS t = 0 × 100 , 5 Inhibition % = A control − A sample or standards A control × 100 6 Separation Factor SF = C Aphron phase C Liquid phase . 7 Encapsulation efficiency, E % = mass of total loaded mass of feed × 100. 8 Polydispersity index PDI = Standard deviation of diameter droplet mean diameter of droplet × 100. 9


RESEARCH ARTICLE
Enchanted stability of butterfly pea flower extract through colloidal gas aphrons (CGA) separation method using Tween-20 surfactant
Tuan Nurul Maisarah Tuan Putra1, Noorain Nasuha Omar1, Mohamad Khairi Zainol1, Elham Taghavi1, Nur Suaidah Mohd Isa1, Masni Mat Yusoff2, Paula Jauregi3, Nurmahani MohdMaidin1*
1Faculty of Fisheries and Food Science, Universiti Malaysia Terengganu, Kuala Terengganu, Terengganu, Malaysia;
2Faculty of Food Science and Technology, Universiti Putra Malaysia, Serdang, Selangor, Malaysia;
3AZTI, Food Reseach, Basque Research and Technology Alliance (BRTA), Parque Tecnológico de Biskaia, Astondo Bidea, Edificio 609, Derio, Bizkaria, Spain
Abstract
Butterfly pea flower (BPF) is known to contain secondary metabolites, including anthocyanins. However, anthocyanins are unstable and easily degraded due to processing during food production, hence making the applications limited. This study aimed to determine the stability of BPF ethanolic extract with colloidal gas aphrons (CGA) separation, which is a surfactant-based separation method. The result showed that anthocyanins recovered by CGA at a volumetric ratio of 20 (AV20) showed higher stability (half-life = 295 days [d]) than in ethanolic extract (EE) (half-life = 43 d) and their stability increased with the concentration Tween-20 in CGA samples (6.07–8.58 mM). Loss of anthocyanins in the CGA-processed sample (AV20) (18.75%) was lower than in ethanolic extract (74.57%). Loss of anthocyanins during storage fitted to a first-order reaction model and the rate constant ranged from 0.0024 d–1–0.0161 d–1. AV20 exhibited lower values of rate constant (0.0024 d–1) compared to EE (0.0161 d–1). Higher concentrations of Tween-20 in aphron phases lead to higher encapsulation efficiency and separation factors. Therefore, we conclude that V20 of CGA-processed sample was more stable than the ratios studied. Although the stabilization effect is not fully understood, these findings contribute to a better understanding of the proposed method. Further research is necessary to explore novel applications of surfactant-based extraction methods.
Key words: anthocyanins, Clitorea ternatea, colloidal gas aphrons, microscopy, surfactant
*Corresponding Author: Nurmahani MohdMaidin, Faculty of Fisheries and Food Science, Universiti Malaysia Terengganu, 21030 Kuala Terengganu, Terengganu, Malaysia. Email: [email protected]
Academic Editor: Saber Amiri, PhD, Department of Food Science and Technology, Faculty of Agriculture, Urmia University, Urmia, Iran
Received: 17 September 2024; Accepted: 17 November 2024; Published: 1 April 2025
© 2025 Codon Publications
This is an Open Access article distributed under the terms of the Creative Commons Attribution-NonCommercial-ShareAlike 4.0 International (CC BY-NC-SA 4.0). License (http://creativecommons.org/licenses/by-nc-sa/4.0/)
Introduction
Butterfly pea flower (BPF) (Clitorea ternatea) is one of the beautiful ornamental climbers planted in gardens or found growing in the wild (Lim, 2012) and is widely found in Asia (Ravindran, 2017). The plant is also used for medicinal as well as health purposes. In Thailand and Malaysia BPF is used in lots of local cuisines and for preparing blue rice and pressed cakes because of its characteristic vivid blue color (Ezzudin, 2018). Numerous authors have discussed and documented the chemical constituents of BPF, particularly the polyphenols and anthocyanins. It is also well known that the anthocyanins from BPF extract (BPFE) have the potential to be the major source of natural pigments. However, many studies have highlighted major drawbacks of using natural anthocyanins in processing, such as degradation when exposed to heat, oxidation, and pH shift (Pham et al., 2020; Jamil et al., 2018; Hamzah et al., 2013). Thus, various emerging techniques are introduced, including ultrasound-assisted extraction, microwave-assisted extraction, supercritical fluid extraction, and ultrafiltration. These approaches are mostly nonthermal processes which operate at a mild temperature, allowing extracting thermally stable compounds while minimizing the degradation of thermolabile compounds. In addition, these methods operate with less time consumption.
In spite of this, conventional methods, particularly solvent extraction, remain the most common phytochemical extraction methods because of their rapid and easy operation. However, selection of a suitable solvent must be considered due to some limitations and the fact that specified organic solvents have the possibility to trigger irreversible degradation of phytochemicals. Therefore, the application of surfactants in separation processes has sparked interest as an alternative to organic solvents. Surfactants are amphiphilic substances with two different functional groups, namely hydrophobic and hydrophilic groups (Free, 2008; Miyake & Yamashita, 2017; Nakama, 2017; Rosen, 2004). The efficiency of extraction using surfactant as compared to water and 70% ethanol was 1.5 and 1.2 times higher, respectively (Skrypnik and Novikova, 2020), and this could be due to their above-mentioned amphiphilic structure.
Colloidal gas aphrons (CGA) is an approach of using surfactants as a medium of extraction. Defined as microbubbles generated from surfactant solutions at high-speed stirring (>8,000 rpm), CGA has its own distinctive properties, compared to conventional foams, such as high stability, low viscosity, and smaller bubbles size. Moreover, CGA is easily separated from the bulk liquid; hence, no further process is needed for the recovery of compounds. Previously, CGA was used to recover polyphenols, particularly anthocyanins, astaxanthin, and proteins, from various by-products (Fuda et al., 2005; MohdMaidin et al., 2018; Spigno and Jauregi, 2005). Moreover, studies showed that CGA separation could lead to stabilization of anthocyanins extracted during storage (MohdMaidin et al., 2019). To the best of our knowledge, there is no study on the effect of Tween-20 on the stability of anthocyanins isolated from BPFE. Therefore, this study aimed at assessing the stability of anthocyanins in CGA-processed samples over time, compared to their stability in crude ethanolic extract (EE) (before CGA separation). It was postulated that the CGA-processed samples would have a higher stability compared to EE.
Materials and Methods
Sample collection and preparation
Dried BPF (C. ternatea) was purchased from Superbee Enterprises (Melaka, Malaysia). The samples were crunched in a grinder mixer (Panasonic MX-337, Panasonic Industrial Devices Malaysia Sdn. Bhd., Shah Alam) and sifted using a vibrating sieve shaker (Octagon D200 Digital, Endecotts Ltd., London) to obtain a particle size of ≤2 mm.
Ethanolic extraction of polyphenols from BPF
The extraction of polyphenols from the sifted samples was carried out by using the method proposed by MohdMaidin et al. (2018) with modification. Ethanol was purchased from Eugene Chem. Sdn. Bhd. (Penang, Malaysia). Phytochemical constituents were extracted by ethanol aqueous extraction (60% v/v) in a shaking water bath (Memmert SV1422, Memmert GmbH, Germany) with a circular motion at 60°C with a speed of 80 rpm for 135 min. The ratio of sample to solvent was 1:8 (w/v). The extract was vacuum-filtered and collected, whereby one portion was stored at room temperature and monitored as a control sample (EE), while the other was further separated using CGA techniques (see Section 2.3).
Separation of BPF ethanolic extract using CGA
The solution of 10-mM Tween-20 was prepared by dissolving the concentrated Tween-20 in distilled water. CGA was generated by subjecting surfactant solution to high-speed stirring homogenizer (IKA T25 Digital Ultra-Turrax, IKA, Germany) (≥8,000 rpm) for 5 min. After generation, the CGA was pumped into a flotation column (diameter: 4 cm, height: 55 cm, and volume: approximately 1,000 mL) containing BFP extract. Briefly, the BFP extract was introduced in the column with known volume by varying volumetric ratio with constant drainage time. The full working parameters are shown in Table 1. The contact time between extract and CGA was recorded. Finally, the drained aphron phase (AP) and liquid phase (LP) were collected separately for further analysis.
Table 1. The parameters used for the effect of varying volumetric ratio to the recovery of polyphenols from BPF extract (MohdMaidin et al., 2019).
| A | B | C | |
|---|---|---|---|
| Initial volume of BPF extract (mL) | 111.11 | 58.82 | 47.62 |
| Volume of CGA estimated (mL) | 888.9 | 941.18 | 952.38 |
| Volumetric ratio (CGA:BPF extract) | 8:1 | 16:1 | 20:1 |
| Contact time (estimated) (min) | 5 | 5 | 5 |
| Flow rate (mL/min) | 177.8 | 188.2 | 190.5 |
| Drainage time (min) | 5 | 5 | 5 |
The concentration of Tween-20 in these fractions was estimated from the separated volume of CGA and corresponding liquid fraction, which was determined by measuring gas hold-up (gas volumetric ratio defined as the volume of air incorporated in each volume of CGA dispersion) of the CGA generated with Tween-20 solution (61.3%). Estimated concentrations in different volumetric ratios were as follows: V4, 6.07 mM, V8, 7.56 mM, and V16, 8.58 mM. The summary of the extraction and separation processes is briefly described in Figure 1.
Figure 1. Flow diagram of ethanolic extraction and CGA-processed samples. All samples were stored at 25°C±3°C for 85 days. BPF: butterfly pea flower.
Storage of EE- and CGA-processed samples
The EE control samples and CGA-processed samples were kept in high-density polyethylene (HDPE) plastic bottles depending on days. The samples, EE, aphron phase with a volumetric ratio of 8 (AV8), liquid phase with a volumetric ratio of 8 (LV8), aphron phase with a volumetric ratio of 16 (AV16), liquid phase with a volumetric ratio of 16 (LV16), aphron phase with a volumetric ratio of 20 (AV20), and liquid phase with a volumetric ratio of 20 (LV20) were stored at 25°C±3°C for 85 days to mimic the real storage application. Color degradation, pH value, total phenolic content (TPC), total flavonoid content (TFC), total monomeric anthocyanins, and antioxidant activity of the extract were determined daily for initial 4 days and then at an interval of 3 days up to 85 days.
Physical analysis
Color analysis
The color intensity of the extracts over time was measured by using a chroma meter (Konica Minolta CR-400; Konica Minolta Inc., Japan). Instrument calibration was performed according to the manual and prior to taking any measurement. A standard white plate was used for standardization. In brief, a portion of the sample was placed in a petri dish. The L*, a*, and b* measurements were recorded, and the chroma and hue angles were calculated based on Equations (1) and (2). Delta E (ΔE) was calculated, as shown in Equation (3). The Commission internationale de l’éclairage/International Commission on Illumination (CIELAB) L* a*, and b* colorimetric system diagram was referred to observe changes in color over time.
ΔE = ([ΔL*]2 + [Δa*]2 + [Δb*]2)1/2 (3)
pH value analysis
The pH value of samples was measured with a pH meter (LAQUA) calibrated using pH 4.0, pH 7.0, and pH 10.0 buffer solutions prior to any measurement.
Chemical analysis
For methods mentioned in Sections 2.6.1–2.7.2, all absorbance values at predetermined wavelength were studied by using a spectrophotometer (Shimadzu UV-1900I, Shimadzu Corporation, Japan).
Total phenolic content
Folin–Ciocalteau (FC) colorimetry method was employed to determine TPC of extract samples. Briefly, 1.5 mL of FC reagent was added to a test tube containing 0.2 mL of sample. The mixture was allowed to react in the dark for 5 min. Then, 1.5 mL of sodium carbonate (6%) was added to each test tube and shaken. The same procedure was also carried out with Gallic acid replacing the extract sample. The sample and standards were allowed to stand in the dark for 90 min at 750-nm wavelength. Results were expressed as milligrams of gallic acid equivalent per gram (mg GAE/g) (Prado et al., 2018).
Total flavonoid content
The total flavonoid content was determined by using aluminium chloride colorimetric method according to Looi et al. (2020) with a slight modification. Briefly, 0.28 mL of the extract sample was added to a test tube containing 1.2-mL distilled water and 90-µL sodium nitrite (5%). The mixture was left to stand for 5 min. Aliquot of aluminium chloride (10%) (90 µL) was added and allowed to stand for 5 min. Then, 1.2 mL of sodium hydroxide (0.5 M) was added and the mixture was allowed to react in the dark for 30 min. The absorbance value of mixtures was measured at 510 nm. The same procedure was also carried out by using Quercetin as a standard, and the results were expressed in milligrams of quercetin equivalent per liter (mg QE/g).
Total monomeric anthocyanins
Two buffer solutions were prepared: (i) 0.0025 M, pH 1 buffer (potassium chloride; Emsure, Germany), and (ii) 0.4 M, pH 4.5 buffer (sodium acetate; Sigma-Aldrich, St. Louis, MO, USA). Prior to analysis, a suitable dilution factor was determined by diluting the samples and adjusting their absorbance to 0.2–1.4 at 520 nm. The samples were further diluted with both buffers in a sample–buffer ratio of 1:4 using the same dilution factor. The absorbance values were taken at 520 nm and 700 nm within 20–50 min of preparation (Lee et al., 2005). Total monomeric anthocyanin content was calculated according to Equation (4),
where A = (A520 nm–A700 nm) at pH 1.0 and (A520 nm–A700 nm) at pH 4.5; MW (molecular weight) = 449.2 g/mol for cyanidin-3-glucoside (cyd-3-glu) and 493.43 g/mol for malvidin-3-glucoside; DF = dilution factor established in D; l = path length in cm; ε = 26,900 molar extinction coefficient (L mol–1 cm–1) for cyanidin- 3-glucoside, 28,000 molar extinction coefficient (L mol–1cm–1) for malvidin-3-glucoside; and 103 is the factor for conversion of gram to milligram.
Antioxidant analysis
ABTS (2,2'-azinobis-3-ethylbenzthiazolin-6-sulfonic acid) assay
The ABTS assay was conducted based on Tuan Putra et al. (2021) with slight modification. The radical solution was prepared by mixing 5 mL of 7-mM ABTS with 80-µL 150-mM potassium peroxodisulfate. The solution was left to stand for 12–16 h. Prior to analysis, the radical solution was adjusted with methanol in order to obtain an absorbance value of 0.70±0.02 at 734 nm. The radical was then left to equilibrate at room temperature upon achieving stability. For analysis, 3 mL of ABTS+ (0.700±0.02, A734 nm) was mixed with 30 µL of sample/blank/standard. In this case, standard solutions of ascorbic acid and trolox were prepared in serial dilutions (0–1,000 µM, and 0–2,000 µM, respectively). The absorbance of the mixture was measured after being incubated in the dark for 6 min at 734 nm. The antioxidant power (% inhibition) was calculated based on Equation (5),
DPPH (2,2-diphenyl-1-picrylhydrazyl) scavenging assay
The DPPH scavenging capacity of the samples and standards was determined according to Looi et al. (2020). Briefly, 125 µM of DPPH was freshly prepared prior to analysis. Then, 2 mL of DPPH radical solution (125 µM) was added to a test tube containing 500 µL of sample/standard. Finally, the mixture was allowed to react in the dark for 15 min at room temperature. After incubation period, the absorbance was measured at 517 nm. Trolox was used as a standard. The antioxidant activity (% inhibition) was calculated using Equation (6),
Characterization of colloidal gas aphrons microbubbles, Tween-20 micelles, and encapsulation of anthocyanins extracted from butterfly pea flower by CGA
Measurement of particle size
Particle size was measured by using particle size analyzer (UNISZA, Kampus Tembila, Besut, Malaysia). The samples were diluted with distilled water to 1,000 dilution factor prior to measurement (Bulatao et al., 2017). The parameters used to measure were refractive index (1.468), absorption index (1.000), and target temperature (25°C). The data obtained corresponded to the size distribution by volume.
The separation factor of the samples was calculated using Equation (7) to determine the affinity of a compound for aphron phase, compared to its affinity for liquid phase (Dahmoune et al., 2013):
The encapsulation efficiency (%) was calculated according to Pu et al. (2020) with slight modification, as shown in Equation (8):
Optic light microscope
The measurement of CGA diameters was performed by using optic microscopy (Leica DM E, Leica Microsystem, German). The measurement method was employed according to Hansen, Hartel and Roos (2021) with modification. Samples’ dispersion, 1 drop, was placed on the glass slides within 1 min of sample preparation and covered with cover slips. Samples were evaluated at 10× magnification. Sample observation, photo capturing, and size bar placement were performed by using the Mathlab R2022b and ImageJ software. The polydispersity index (PDI) of samples was calculated by using Equation (9) to determine uniformity value (Romoscanu et al., 2010),
Statistical analysis
Statistical analyses were carried out in triplicate (n = 3), and the results were reported as mean ± standard deviation (SD). Significant differences between the data were determined by using a one-way Analysis of Variance (ANOVA) and Tukey’s multiple comparison test at 95% confidence interval (95% CI) as performed by the Minitab 20 statistical software.
Results and Discussion
Color and pH analysis
Initially, the pH values of EE and six CGA-processed samples were measured on day 0. Changes in the pH values of the samples during storage are shown in Figure 2A. With the exception of AV16 and LV16, the pH values of EE and CGA-processed samples at ratios of 8 (AV8 and LV8) and 20 (AV20 and LV20) exhibited statistically significant differences after 7 days of storage. However, specifically in the case of CGA-processed sample at a ratio of 16, its pH showed a distinct statistical difference after 17 days of storage, compared to other samples. Further decrease in pH was observed in all samples over a storage period of 85 days (Table 2). This decrease in pH values of the samples could be due to an increase in ascorbic acid content, which was analyzed by ABTS scavenging radical analysis (Figure 2B). A possible explanation for this could be the storage conditions employed. By storing the samples in the dark, the potential degradation caused by exposure to light, which may lead to the breakdown of ascorbic acid, was minimized. As a result, ascorbic acid in the samples could be more stable, leading to the observed increase in its content and contributing to a relatively constant rate of antioxidant activity.
Table 2. pH values of ethanolic extract and CGA-processed samples over time.
| Samples Days | EE | AV8 | LV8 | AV16 | LV16 | AV20 | LV20 |
|---|---|---|---|---|---|---|---|
| 0 | 6.02±0.01a | 5.68±0.02a,b | 5.67±0.03a | 5.60±0.00a,b | 5.63±0.01a | 5.60±0.03a | 5.57±0.03a |
| 1 | 6.07±0.03a | 5.74±0.02a | 5.64±0.010a | 5.62±0.03a | 5.59±0.03a | 5.57±0.05a | 5.55±0.01a |
| 7 | 5.92±0.01b,c | 5.58±0.10b | 5.44±0.05b | 5.54±0.05b | 5.57±0.02a | 5.31±0.14b | 4.87±0.01c |
| 17 | 5.85±0.02c | 5.40±0.00c | 5.35±0.01c | 5.32±0.01c | 5.27±0.01b | 4.85±0.01c | 4.84±0.00c |
| 31 | 5.87±0.02b,c | 5.40±0.08c | 5.37±0.03b,c | 5.28±0.01c,d | 4.57±0.06c | 4.54±0.01d,e | 4.87±0.01c |
| 60 | 5.86±0.02b,c | 5.35±0.05c | 5.22±0.01d | 5.20±0.01d | 4.45±0.05d | 4.68±0.02d | 4.64±0.01d |
| 85 | 5.92±0.04b | 5.31±0.01c | 5.24±0.03d | 5.25±0.04c,d | 4.31±0.01e | 4.51±0.01e | 5.05±0.03b |
EE: ethanolic extract; AV8: aphron phase with volumetric ratio 8; LV8: liquid phase with volumetric ratio 8; AV16: aphron phase with volumetric ratio 16; LV16: liquid phase with volumetric ratio 16; AV20: aphron phase with volumetric ratio 20; LV20: liquid phase with volumetric ratio 20.
Results were expressed as mean ± standard deviation.
Different superscripted lowercase letters show statistically significant differences between values (P < 0.05) among rows.
Figure 2. (A) pH values of samples; and (B) total ascorbic acid content during storage intervals. Notes: EE: ethanolic extract; AV8: aphron phase with volumetric ratio 8; LV8: liquid phase with volumetric ratio 8; AV16: aphron phase with volumetric ratio 16; LV16: liquid phase with volumetric ratio 16; AV20: aphron phase with volumetric ratio 20; LV20: liquid phase with volumetric ratio 20.
Surprisingly, a recent study conducted by Fu et al. (2021) noted that BPFE with pH = 4–8 and stored at lower temperature for 65 days was more stable. For example, samples stored at 4°C with pH < 8 remained bright in color and the degradation of color was not distinguishable by the naked of eye, but in case of samples stored at 50°C with pH = 4–8, the hue of blue-green color remained stable. Regardless of the storage temperature ranging from 4°C to 50°C, the color of BPFE at pH = 9–13 changed to yellow, indicating that anthocyanin was hydrolyzed, which changed its original structure to chalcone base. Quinonoid base of ternatins was more stable at pH < 7 because of the protection of 3’- and 5’-long polyacylation side chains. Hence, Fu et al. (2021), deduced that anthocyanins from BPFE could be most stably stored under low temperatures and neutral pH conditions, while alkaline conditions (pH > 8) should be avoided. These findings strengthen the results of our study, which showed that Tween-20 as a carrier helps to maintain the pH value of BPF ranging from 4.31 to 5.83 for 85 days of storage, thus preventing anthocyanins from hydrolyzing. Hence, the surfactant can be used for the extraction of anthocyanin pigment from BPF.
Moreover, anthocyanin pigment extracted under a low pH could result in unstable anthocyanins. For example, a study done by Pham et al. (2020) revealed that the use of 1.5-N hydrochloric acid and 1.5-N acetic acid in their formulations combined with 50% of ethanol and distilled water increased the pH and affected the stability of tested anthocyanin (cyanidin) during storage. These contradictory results to the findings of Fu et al. (2021) could be due to different anthocyanin compounds evaluated. Jamille et al. (2020) studied the anthocyanins stability of spray-dried Solanum melongena L. with 15% of gum Arabic as a carrier, and discovered that pH decreased slowly throughout the 30-day storage period by adding encapsulated extract to natural yoghurt. This might be due to the presence of extracting solvent residue in nonencapsulated extract leading to a rapid decrease in pH.
The color intensity of EE and CGA-processed samples was determined by using a colorimeter. The L*, a*, and b* color space was measured and the colorimetric parameters chroma (C), hue (h), and ΔE were calculated. Figures 3A and 3B showed changes of color in chroma and hue angle for EE control and CGA-processed samples throughout the storage. On day 0, it was apparent that the hue angle and chroma for EE control (hue = 15.83, and chroma = 1.34) were much lower than that in the CGA-processed samples (hue = 304.19–342.34, and chroma = 2.43–7.41). Over time, hue in EE decreased rapidly and by day 85, hue = 6.5, while hue was more steady in AV8, LV8, and AV16 (hue = 316.42–339.29). However, it is interesting to note that hue (306.21–313.35) in LV16, AV20, and LV20 increased slightly. The increase in hue values indicated that the coloring compounds were protected during storage. In this study L* (lightness) increased throughout the storage period. The elevated L* throughout the storage was in agreement with the findings reported by Jamille et al. (2020), who studied the encapsulation of Solanum melongena bark with 15% of gum Arabic. They concluded that increase in L* shows the discoloration of sample due to the degradation of anthocyanins. In contrast to the prior findings of Hamzah et al. (2013), it was observed that the L* parameter of BPF encapsulated by maltodextrin and gum Arabic decreased throughout the 30 days of storage. The authors suggested that a brown pigment from the Maillard reaction could occur if BPF was exposed to a high temperature during drying, resulting in a darker color. However, this contrariness might be due to the different applications of extraction and encapsulating agents.
Figure 3. (A) Chroma values of samples; (B) Hue angle of samples; and (C) total color difference (ΔE) between samples. Notes: EE: ethanolic extract; AV8: aphron phase with volumetric ratio 8; LV8: liquid phase with volumetric ratio 8; AV16: aphron phase with volumetric ratio 16; LV16: liquid phase with volumetric ratio 16; AV20: aphron phase with volumetric ratio 20; LV20: liquid phase with volumetric ratio 20.
However, chroma presented a different trend as compared to hue, whereby it in EE and CGA-processed samples decreased gradually after 85 days (Figure 3A). It is important to note that the chroma value (C) describes the relative strength of color; the higher the C, the more saturated the range of colors that humans can perceive (Madrona, 2020). Therefore, in relation to the results obtained in this study, it is implied that colors of the samples decrease significantly with increase in the storage time. The –b* value shows blueness whereas +b* shows yellowness. Based on the results, all CGA-processed samples showed -b* value whereas EE showed +b* value. At 30-day storage period, the b* value of all samples increased, indicating that the samples attained yellowness. This could be due to the conversion of flavylium cation (colored) into a colorless or yellowish form. Another reason could be the higher concentration of chalcone during storage, and this observation was in agreement with the studies done by Jamille et al. (2020) and Rocha-Parra et al. (2017), since both reported increase in b* value by the encapsulation of Solanum melongena with gum Arabic and that of red wine with a combination of maltodextrin and gum Arabic, respectively.
Other than this, all samples in this study showed a positive a* parameter which indicated redness. All CGA-processed samples had a higher a* value, compared to EE. After 85 days of storage a* value of all samples decreased gradually and the results were similar to the study conducted by Hamzah et al. (2013). They found that vacuum oven-dried samples showed more stable a* compared to freeze-dried samples. They further reported that vacuum oven-dried samples were more stable than freeze-dried samples because of the formation of powder either in crystalline form or amorphous form. In terms of stability, crystalline structure was more stable than amorphous form. The authors also found that freeze-dried powder was more porous whereas freeze-dried powder was more crystalline.
In brief, higher values of ΔE imposed more changes in color and vice versa. Figure 3C demonstrates that the ΔE values for EE and LV8 were overlapping on days 1, 24, 31, 46, and 85, implying that both samples were not significantly different on the mentioned days. It was observed that ΔE in CGA-processed samples was similar to that in EE (Figure 3C). Further decrease was observed for LV16, AV20, and LV20 from day 31 up to day 85. No significant changes were observed in EE, AV8, LV8, and AV16 after 85 days. Based on the results, ΔE in all samples was below 3 and the discoloration of samples was not easily distinguishable with naked eyes. However, these results differ from a recent study conducted on nanocapsules using zein solution by electrospraying of Biloxi blueberries extract. The authors found that the total color difference of all samples was more than 3, made it more perceptible to human eye (González-Cruz et al., 2023). This contrary finding might be due to different compounds accumulated in samples, resulting in different types of reactions that might have taken place during the extraction and processing of samples.
Total phenolic content
In order to evaluate TPC of samples, Folin–Ciocalteau assay measured at 750 nm was employed. Soon after ethanol extraction and CGA processing, the phenolic content (expressed as GAE) of all samples was found to range between 5.47 and 32.47 mg of GAE/g dry weight (Table 3). Theoretically, the reaction of Folin reagent with the phenolic group being oxidized resulted in the reduction of color from yellow to dark blue (Agbor et al., 2014), which made this method more selective.
Table 3. Total loss of phenolic content measured at 750 nm over time.
| Samples | Total phenolic content (750 nm) | ||
|---|---|---|---|
| Day 0 (mg/g) | Day 85 (mg/g) | Total loss (%) | |
| EE | 32.47±0.20 | 27.75±0.16 | 14.54c,d |
| AV8 | 12.53±0.03 | 11.15±0.06 | 11.01d |
| LV8 | 10.56±0.07 | 8.30±0.10 | 21.40b |
| AV16 | 8.26±0.13 | 6.84±0.07 | 17.19c |
| LV16 | 6.54±0.05 | 5.07±0.05 | 22.48b |
| AV20 | 6.26±0.19 | 4.54±0.05 | 27.48a |
| LV20 | 5.47±0.13 | 3.82±0.03 | 30.16a |
EE: ethanolic extract; AV8: aphron phase with volumetric ratio 8; LV8: liquid phase with volumetric ratio 8; AV16: aphron phase with volumetric ratio 16; LV16: liquid phase with volumetric ratio 16; AV20: aphron phase with volumetric ratio 20; LV20: liquid phase with volumetric ratio 20.
Results were expressed as mean ± standard deviation.
Different superscripted lowercase letters show statistically significant differences between values (P < 0.05) among rows.
In brief, during storage, the phenolic content of CGA-processed samples was found to be more stable because TPC showed a moderate decrease compared to EE control sample (Figure 4). Phenolic compounds immediately degrade during storage because of oxidation and hydrolytic reactions (Kotsiou and Tasioula-Margari, 2016). Hence, changes in TPC during storage were expected. In a nutshell, minimal decrease in TPC was observed in all samples possibly because of the absence of light during storage, which could facilitate oxidation and polymerization reactions, resulting in structural changes in phenolic compounds (Ali et al., 2018).
Figure 4. (A) Total phenolic content; (B) total flavonoid content; and (C) total anthocyanin content of BFP samples extracted by ethanol (EE) and Tween-20 with different volumetric ratios (V8, V16, and V20). Notes: EE: ethanolic extract; AV8: aphron phase with volumetric ratio 8; LV8: liquid phase with volumetric ratio 8; AV16: aphron phase with volumetric ratio 16; LV16: liquid phase with volumetric ratio 16; AV20: aphron phase with volumetric ratio 20; LV20: liquid phase with volumetric ratio 20.
Among the CGA-processed samples, the TPC showed the lowest losses in AV8, followed by EE (14.54%), AV16 (17.19%), LV8 (21.40%), LV16 (22.48%), AV20 (27.48%) and, finally, LV20 (30.16%) (Table 3). Different trends were reported by MohdMaidin et al. (2019), who found that the lowest loss of TPC content from grape pomace was in V16 (4.91%), followed by V8 (5.44%), and V4 (6.42%). This rather contradictory result could be due to the variant phenolic compounds present in samples producing different results. Recent study done by Aryal et al. (2019) assumed that the presence of carotenoids, sugar as well as ascorbic acid in samples could affect the composition of phenolics.
In addition, Çam et al. (2013) evaluated maltodextrin as a microcapsule. Authors found that the total loss of phenolic content in microcapsules (~7.3%) stored at 4°C for 3 months was more stable, compared to phenolic powder (~35%). These findings supported the concept of encapsulation using maltodextrin and were improved by the findings of recent studies. For instance, Tolun et al. (2020) provided relevant data on the stability of microencapsulated grape pomace extract stored at 25°C with varying relative humidity (RH) (33% and 52%) for 75 days. The authors discovered that the combination of maltodextrin with gum Arabic resulted in a more stable surface and structure of encapsulation. MDDE4-7–GA in a ratio of 8:2 and at varying humidity levels of 33% and 52% was the best combination that showed the lowest TPC loss of 3.3% and 14%, respectively, compared to gallic acid powder, which showed TPC lossess of 64.9% at 33% RH and 38.5% at 52% RH. A high total loss of control (gallic acid powder) during 75 days of storage was due to the absence of carrier agent, which makes the sample more hygroscopic, resulting in the absorption of more water and, therefore, more susceptible to degradation. This finding proved that samples were more stable in the presence of wall materials because it could protect phenolic compounds because of the ability to assemble macromolecules, thus providing physical protection to smaller molecules.
Going further, the TPC values of CGA-processed sample AV8 and sample AV16 were comparable with EE, as there was no statistical difference (P < 0.05) between these three samples (Table 3). Similar results were also reported in a work done by MohdMaidin et al. (2019), which found that the extractable TPC from grape pomace by CGA (V4, V8, and V16) showed no statistical difference. The degradation of extractable phenolic compounds was due to the fact that most polyphenols are highly reactive and thus unstable and degrading into a variety of products (Kafkas et al., 2018).
Among CGA-processed samples, the aphron phase of each volumetric ratio was observed to have a stabilizing effect on TPC content, rather than the liquid phase. The stabilization effect provided by Tween-20 surfactant in CGA could be explained by the formation of micelles. Micelles are acknowledged as amphiphilic structures that comprised both hydrophobic and hydrophilic groups, formed when the surfactant concentration reached CMC level, thus dissolving both polar and nonpolar molecules. Azad et al. (2018) reported in their findings that a nonionic surfactant, Span 80, mediated by aqueous solution was chemically bonded with the polar and nonpolar molecules of polyphenol and created a hydrogen bond. Thus, a constant phenolic compound was achieved. In addition, the phenomenon that might have occurred when surfactant was added to extractable phenols was that large and uncompacted micelles were compacted and became smaller with increased concentration of surfactant, causing more phenols to be absorbed into micelles, preventing it from contacting peroxidase, resulting in reduced oxidation (Torres et al., 2016).
Total flavonoid content
In this storage study, flavonoid contents were quantified by using aluminium chloride in a colorimetric method. The overall trend of total flavonoid content in all samples during the storage period is summarized in Figure 4B. In the obtained results, the lowest initial value of flavonoid content was observed in LV20, followed by AV20, LV16, AV16, LV8, AV8, and, finally, EE. The flavonoid content of BPF extracted with 60% ethanol was considered high as compared to the flavonoid content reported by Jaafar et al. (2020) with 187.05 mg QE/g. This could be due to the ethanol concentration of 37%. A higher volume of water indicating higher polarity of a solvent could be the reason for extracting bioactive compounds. Quercetin is a polar polyphenolic compound (Dai and Row, 2019). It was observed in a study done by Jaafar et al. (2020) that using a solvent with higher water content, specifically 63%, could enhance the dissolution and extraction of quercetin yielding 187.05 mg QE/g. However, in contrast to our study, a solvent with 40% water was used, indicating a lower polarity of the extraction medium. Despite this low polarity, the solvent exhibited good solubility and extraction efficiency for quercetin, resulting in a higher yield of 215.3 mg QE/g compared to the findings of Jaafar et al. (2020). Therefore, choosing appropriate solvent polarity is crucial to optimize the extraction process of quercetin and other bioactive compounds.
Going further, the degradation of flavonoid content (quercetin equivalent) during storage was investigated. The flavonoid contents of all samples reduced at 85-day storage and this loss ranged from 32.88% to 70.95% (Table 4). It was observed that the highest total loss was in AV20 and LV20, followed by LV16, AV16, LV8, AV8, and, finally, EE. This showed that the presence of surfactant did not provide stability to flavonoid compounds. The possible reasons could be the inability of quercetin to solubilize in Tween-20 micelles and adsorbed onto CGA, resulting in the least stable compound during storage. Similar finding was noted by David et al. (2008), who found that the interaction of flavonoids with Tween-80 only happened with rutin and naringenin, but not with quercetin, with which it, to a larger extent, produced quercetin precipitate. Different molecular structures of different flavonoids could be the reason of interaction with surfactant micelles. Quercetin features as a more planar molecular structure than naringenin, which has a kink in its structure. Thus, naringenin molecule would become slightly amphiphilic and results in solubilization with surfactant micelles.
Table 4. Total loss of flavonoid content during storage interval.
| Sample | Day 0 (mg QE/g) |
Day 85 (mg QE/g) |
Total loss (%) |
|---|---|---|---|
| EE | 215.30±0.00 | 144.52±0.80 | 32.88f |
| AV8 | 81.32±2.00 | 47.17±1.04 | 41.99e |
| LV8 | 70.32±0.20 | 33.75±0.02 | 52.01d |
| AV16 | 64.52±2.00 | 26.79±0.14 | 58.48c |
| LV16 | 61.52±0.20 | 20.25±0.00 | 67.08b |
| AV20 | 59.72±0.40 | 18.15±0.14 | 69.61a |
| LV20 | 57.72±0.00 | 16.77±0.52 | 70.95a |
EE: ethanolic extract; AV8: aphron phase with volumetric ratio 8; LV8: liquid phase with volumetric ratio 8; AV16: aphron phase with volumetric ratio 16; LV16: liquid phase with volumetric ratio 16; AV20: aphron phase with volumetric ratio 20; LV20: liquid phase with volumetric ratio 20.
Results were expressed as mean ± standard deviation.
Different superscripted lowercase letters show statistically significant differences between values (P < 0.05) among rows.
The total loss of compounds as shown in Table 4 indicates that flavonoids are less stable than phenolic compounds. The stability behavior of both compounds was in agreement with the study conducted by Rocha-Parra et al. (2017) for the compounds in wine encapsulated with 9% concentration of blended maltodextrin and gum Arabic in a ratio of 65:35. The authors reported that catechin was less stable than selected phenolic compounds. In addition, it was found that the total loss of catechin was considerably high (65%) if the red wine powder was stored at a water activity of 0.33 at 38°C for 145 days. However, this finding was in contrast with a prior study conducted by Galmarini et al. (2013) on red wine but encapsulated. Their results showed that the loss of catechin ranged between 15% and 25%, and apparently these compounds showed a small loss as compared to epigallocatechin (61%). These contradictory findings could be due to different storage periods. Recamales et al. (2006) reported that the amount of catechin in wine decreased over time; for example, the wine stored for 10 months had a mean catechin concentration of 1.31 mg/L, while after 12 months, catechin was not detected.
Furthermore, Kallithraka et al. (2009) also reported data on polyphenol compounds from unencapsulated wine produced by Vitis vinifera and stored from 3 to 9 months and at lower storage temperature (15°C). During storage, the epicatechin content decreased with time ranging from 28% to 88% whereas catechin content increased for initial 3 months but decreased by 42% at the end of storage period. Chemical changes in polyphenolic compounds were expected and gradually changed mainly because of oxidation, hydrolysis, and complexation throughout the storage of wine and aging. The reactions of flavan-3-ol, anthocyanins, proanthocyanidins, and other compounds included pyruvic acid, acetaldehyde, and glyclic acid as well as reactions between flavonols lead to the formation of new pigments (Recamales et al., 2006).
Total monomeric anthocyanins
The basic method of quantifying anthocyanin content is the pH differential method, in which the samples were diluted with aqueous pH 1.0 and pH 4.5 buffers and absorbance measurements were recorded at wavelengths of 520 nm and 700 nm. In addition, Siti Azima et al. (2014) suggested that total monomeric anthocyanins stipulated the quantification of total anthocyanin, except for anthocyanin degradation products and polymeric anthocyanin.
In this study, the total anthocyanin content (TAC) of ethanolic extract and CGA-processed samples are shown in Figure 4C, and ranged from 0.38 mg CyaE/g to 4.62 mg CyaE/g. The trend showed that total anthocyanins decreased gradually, except for EE, in which the decrease was more rapid. This result was in line with our prior study that reported how the TAC of grape pomace extracted by CGA declined with storage period (MohdMaidin et al., 2018). Hence, the authors concluded that the anthocyanin compounds recovered by CGA had a greater stability than the stability of control sample, and the stability enhanced with the increased concentration of Tween-20. Furthermore, a comparable study was conducted by Piyarat et al. (2014), who observed that within 12 days, roselle solution turned from pink to yellowish and roselle was more stable in buffer, followed by Tween-80 and, finally, SDS. The authors deduced that, compared to Tween-80, a nonionic surfactant, SDS, a negative surfactant, was likely to have a greater impact on color.
Further calculation on the percentage of loss was done to determine the sample that was the most stable one in terms of total anthocyanins (Table 5). Over a storage period of 85 days, different trends were noted in comparison to TPC and TFC. Interestingly, the highest degradation of TAC (74.57%) was observed in EE, significantly different from all the CGA-processed samples. Among all CGA-processed samples, the highest loss of TAC content was in LV8 (52.73%), followed by AV8 (45.63%), LV16 (45.36%), AV16 (43.70%), and LV20 (26.31%), and the least loss was observed in AV20 (18.75%). It was interesting to note that increase in the concentration of Tween-20 caused minimal loss of total anthocyanin. This result could be explained by the fact that anthocyanin acylation and glycosylation improved anthocyanin stability. Another possible explanation for this was other phenolic compounds present in BPF petals potentially interacted as a co-pigment to retain and stabilize anthocyanin chromophores (Siti Azima et al., 2014).
Table 5. Total loss of cyanidin content during storage interval.
| Samples | Day 0 (mg/g) | Day 85 (mg/g) | Total loss (%) |
|---|---|---|---|
| EE | 4.62±0.29 | 1.18±0.00 | 74.57a |
| AV8 | 1.38±0.00 | 0.75±0.00 | 45.63b |
| LV8 | 1.17±0.07 | 0.52±0.00 | 55.45b |
| AV16 | 0.79±0.01 | 0.45±0.01 | 43.70b |
| LV16 | 0.65±0.01 | 0.35±0.03 | 45.36b |
| AV20 | 0.43±0.07 | 0.35±0.01 | 18.75c |
| LV20 | 0.38±0.02 | 0.28±0.04 | 26.31c |
EE: ethanolic extract; AV8: aphron phase with volumetric ratio 8; LV8: liquid phase with volumetric ratio 8; AV16: aphron phase with volumetric ratio 16; LV16: liquid phase with volumetric ratio 16; AV20: aphron phase with volumetric ratio 20; LV20: liquid phase with volumetric ratio 20.
Results were expressed as mean ± standard deviation.
Different superscripted lowercase letters show statistically significant differences between values (P < 0.05) among rows.
The same observation was also noted in encapsulated anthocyanins that were added in yoghurt (Jamille et al. 2020). The stability was similar to that found in a previous study reported by Hamzah et al. (2013) for anthocyanin content extracted from BPF encapsulated with three formulations, namely maltodextrin, gum Arabic, and a combination of both hydrocolloids. The combination of maltodextrin and gum Arabic showed a constant value of TAC throughout the storage of 4 weeks. Based on these finding, it is therefore possible to state that the stability of anthocyanin compound could be enhanced by encapsulation techniques. In other respects, a study reported that encapsulation techniques improved bioactive compounds by allowing retention of their properties over an extended period (Carolina et al., 2019).
In this study, anthocyanin compounds in CGA-processed samples were shown to be more stable than the control sample (EE). The possible mechanism involved in the CGA process was the ability of micelles to establish a hydrophobic and hydrophilic interaction with anthocyanin compounds. Thus, more stable anthocyanins were observed during the storage period. These results corroborated the ideas of Azad et al. (2018), who described that in a colloidal emulsion of Span 80, micelles could encapsulate anthocyanin compounds with a hydrophobic layer. This encapsulation technique resulted in the encapsulation of active compounds, particularly anthocyanins, during processing.
There were also not much differences in the TAC losses of EE (75%) in comparison to another study. Pham et al. (2020) found 68.02% and 58.66% losses of cyanidin extracted by 50% of ethanol and distilled water, respectively. Furthermore, the initial cyanidin content was 577.78 cya mg/L while Pham et al. (2020) found 47.59 cya mg/L (extracted with 50% ethanol) and 52.35 cya mg/L (extracted with distilled water). This contradictory result could be explained by the different species of BPF used as well as different extraction conditions employed. It is also interesting to point out that in the same study, the loss of anthocyanins highly depended on pH shift, rather than the temperature used during storage. Evidently, the lowest loss of anthocyanin (32.53% loss) was found in BPF extracted with 50% ethanol with 1.5-N HCl stored at 10°C (Pham et al., 2020). These results suggested that pH significantly affects the total anthocyanin properties of samples throughout the storage, as opposed to temperature, although high temperature should be avoided to prevent hydrolyzation of 3-glycoside structure.
Degradation kinetics of total anthocyanin content
In this study, the kinetic degradation of anthocyanins during storage was deduced for a better interpretation of anthocyanin degradation. The degradation of anthocyanins extracted from BPF has been studied and well documented (Charurungsipong et al., 2020; Lee et al., 2011; Marpaung et al., 2020; Muche et al., 2018). Generally, the degradation kinetics of anthocyanins followed the first-order reaction and has been reported in literature (Amendola et al., 2010; Marpaung et al., 2020). Figure 5 and Table 6 show the degradation kinetics of anthocyanins in control sample (EE) and CGA-processed samples throughout the storage study.
Figure 5. Degradation kinetics of anthocyanins during storage at room temperature. Error bar represents means ± SD. Linear line represents the fitting of data with first-order kinetics. Notes: EE: ethanolic extract; AV8: aphron phase with volumetric ratio 8; LV8: liquid phase with volumetric ratio 8; AV16: aphron phase with volumetric ratio 16; LV16: liquid phase with volumetric ratio 16; AV20: aphron phase with volumetric ratio 20; LV20: liquid phase with volumetric ratio 20.
Table 6. Degradation kinetic parameters of anthocyanins during storage at room temperature.
| Samples | R | K (d-1) | T1/2(d) | Losses (%) |
|---|---|---|---|---|
| EE | 0.8668 | 0.0161±0.00a | 43±2.01c | 74.57 |
| AV8 | 0.9435 | 0.0072±0.00b | 97±0.00b,c | 45.63 |
| LV8 | 0.9105 | 0.0088±0.00b | 80±14.28b,c | 52.73 |
| AV16 | 0.8922 | 0.0068±0.00b | 103±1.17b,c | 43.70 |
| LV16 | 0.9497 | 0.0071±0.00b | 98±10.89b,c | 45.36 |
| AV20 | 0.8493 | 0.0024±0.00c | 295±114.09a | 18.75 |
| LV20 | 0.6853 | 0.0037±0.00c | 189±41.84a,b | 26.31 |
EE: ethanolic extract; AV8: aphron phase with volumetric ratio 8; LV8: liquid phase with volumetric ratio 8; AV16: aphron phase with volumetric ratio 16; LV16: liquid phase with volumetric ratio 16; AV20: aphron phase with volumetric ratio 20; LV20: liquid phase with volumetric ratio 20.
Results were expressed as mean ± standard deviation.
Different superscripted lowercase letters show statistically significant differences between values (P < 0.05).
The degradation rate of EE and CGA-processed samples (AV8, LV8, AV16, LV16, AV20, and LV20) was 0.0161, 0.0072, 0.0088, 0.0068, 0.0071, 0.0024, and 0.0037, respectively. Meanwhile, the respective half-life (t1/2) was 43, 97, 79, 103, 97, 295, and 189 days. The first-order rate constant of EE was notably higher (k = 0.0161 d–1), compared to all CGA-processed samples. A study conducted by Wu et al. (2018) deduced that the higher the k value, the faster the reaction rate and anthocyanin degradation. This implied that the presence of surfactant increased anthocyanin storage stability. Among CGA-processed samples, AV20 was found to have the lowest (k = 0.0024 d–1) first-order rate constant. Significant increase in degradation rate (k) was observed with increased concentration of Tween-20. The half-life of anthocyanins decreased significantly with increase in the concentration of Tween-20. Therefore, it can be said that the sample with the highest stability was AV20, followed by LV20 and AV16. Further, LV16 and AV8 showed a similar stability (t1/2 = 97 days). The sample with the lowest concentration of Tween-20 (LV8) showed a lower stability (t1/2 = 79 days). Controlled sample (EE) was found to degrade faster over time.
In a study conducted by Marpaung et al. (2012) on the stability of BPF anthocyanins, the findings revealed that the color intensity was retained when stored at 4°C, compared to those stored at 25°C. Hence it approved that the degradation of anthocyanins in BPF was accelerated by high storage temperature (Lee et al., 2011). In line with the study conducted by Aksay (2004), it was suggested that for a long-term storage, Shalgam products (purplish red-colored beverage prepared from black carrot) should be kept refrigerated; however, for a short-term consumption, these can be kept at room temperature. This was due to the rate constant (k) of Shalgam (control, pasteurized, and sorbate-added) stored at 25°C or higher, compared to those stored at 4°C. Moreover, one interesting finding is that the half-life of anthocyanins in the ethanolic extract of BPF stored at 25°C was 43 days. These results were comparable to those reported by MohdMaidin et al. (2019), who found that the half-life of anthocyanin in the ethanolic extract of red grape pomace stored at 20°C was 43 days. A possible explanation for this could be that both BPF and red grape pomace comprised the same types of anthocyanins, possibly, delphinidin 3-o-glucoside (MohdMaidin et al., 2019; Oguis et al., 2019).
A recent study conducted by Jamille et al. (2020) hypothesized that the stability of anthocyanins could be enhanced by encapsulation techniques. The authors deduced that encapsulated anthocyanins obtained from Solanum melongena L. added to yogurt remained stable during the storage period of 30 days. However, yogurt prepared with unencapsulated anthocyanins showed a deceleration of anthocyanin levels after 30 days of storage. Drastic reduction in anthocyanin levels could be related to the oxidation of compound in samples. In line with another study, rate of reaction of unencapsulated anthocyanin from Berberis vulgaris at 25°C was higher (k = 9.2 × 10³ d–1) than the spray-dried maltodextrin-encapsulated B. Vulgaris (k = 4.4 × 10³ d–1). In this study, the rate of reaction of EE was higher than that of CGA-processed samples, especially AV20, possibly because of the encapsulation of anthocyanins by CGA, thus enhancing the stability of anthocyanins.
Antioxidant activity
Polyphenols are one of the most notable antioxidants. They donate one electron to free radicals, which become stable as their electrons are coupled. Hence, it helps in preventing any damage to cells and tissues because of oxidative stress (Wu et al., 2018). The antioxidant activity of EE and CGA-processed samples throughout the storage period was evaluated and data are presented in Figures 6A and 6B. For the initial 3 days, EE, LV8 and AV20 were statistically different; however, after 81 days of storage, controlled sample (EE) showed a slight increase in antioxidant activity. Previous literature reported that the extracts had significant free radical scavenging capacity in vitro, which increased with extract concentration (Al-Snafi, 2016). In addition, the effect of BPF on DPPH scavenging was probably related to its hydrogen-donating capacity, which results in radical scavenging, and hence reduced DPPH absorption (Raja and Pugalendi, 2010).
Figure 6. (A) Percentage of inhibition by DPPH and (B) percentage of inhibition by ABTS during storage interval. Notes: EE: ethanolic extract; AV8: aphron phase with volumetric ratio 8; LV8: liquid phase with volumetric ratio 8; AV16: aphron phase with volumetric ratio 16; LV16: liquid phase with volumetric ratio 16; AV20: aphron phase with volumetric ratio 20; LV20: liquid phase with volumetric ratio 20.
The evaluation of ABTS assay (Figure 6B) showed that reduction in antioxidant activity was significant for AV8, LV16, and AV20 during initial 3 days. Further declination of antioxidant activity was observed in all samples after 7 days. On the other hand, the ABTS assay was employed to evaluate both hydrophilic and lipophilic antioxidants (Kazazic et al., 2016; Labiad et al., 2017). Therefore, antioxidant activity, presumably due to the presence of polyphenols, included phenolic, flavonoid, and anthocyanin compounds, which resulted in the reduction of hydroperoxides that inactivated free radicals (Raja and Pugalendi, 2010). The results showed decrease in antioxidant activity during the initial 14 days of storage time (Figure 6) and remained almost constant until the end of storage period despite loss in phenolic and flavonoid compounds (Tables 3 and 4). The reason for this is still unclear. However, it could be possible that the unencapsulated phenolics present on the surfaces of microcapsules because of microencapsulation process are more prone to the reaction with oxygen, which resulted in degradation and a decrease in antioxidant activity (Tolun et al., 2020).
In a nutshell, bioactive compounds, including TPC and TFC, present in BPF extract could be responsible as well for antioxidant activity. In agreement with the findings of a study conducted by Kazazic et al. (2016), a positive correlation was discovered between total phenol content and antioxidant activity of medicinal plants. Overall, phenolic and flavonoid compounds were positively correlated with DPPH (0.872 and 0.812, respectively) at P < 0.01 (Table 7). The values were similar to the findings reported in a previous studies by Lu et al. (2019) and Kallithraka et al. (2009). For instance, Lu et al. (2019) found that Pearson’s positive correlation of flavonoid content with DPPH was 0.910 (P < 0.01). Similarly, Kallithraka et al. (2009) showed the evolution of phenolic compounds during storage toward antioxidant activity (determined by DPPH scavenging assay). It was found to have a positive Pearson’s correlation ranging from 0.569 to 0.942 (P < 0.01). In brief, flavonoids are widely distributed in plants as glycosides, and most polyphenols offer protection via multiple mechanisms, such as quenching free radicals and chelating metal complexes to produce inactive species (Wong et al., 2006). These findings were consistent with the current study, which found that phenolic compounds have a significant effect on DPPH free radical scavenging (Kazazic et al., 2016).
Table 7. Pearson correlation table between bioactive compounds and antioxidant activity.
| Correlations | TPC 750 nm | TPC 280 nm | TFC | TAC Malvidin | DPPH | ABTS | |
|---|---|---|---|---|---|---|---|
| TPC 750 nm | r-value | 1 | 0.211 | 0.013 | 0.849 | 0.997* | –0.273 |
| P-value | – | 0.864 | 0.992 | 0.355 | 0.049 | 0.824 | |
| TPC 280 nm | r-value | 0.211 | 1 | –0.975 | –0.337 | –0.998* | 0.829 |
| P-value | 0.864 | – | 0.144 | 0.781 | 0.045 | 0.378 | |
| TFC | r-value | 0.013 | –0.975 | 1 | 0.539 | 0.750 | 0.982 |
| P-value | 0.992 | 0.144 | – | 0.637 | 0.460 | 0.121 | |
| TAC Malvidin | r-value | 0.849 | –0.337 | 0.539 | 1 | 0.766 | 0.715 |
| P-value | 0.355 | 0.781 | 0.637 | – | 0.444 | 0.493 | |
| DPPH | r-value | 0.997* | –0.998* | 0.816 | 0.766 | 1 | 0.805 |
| P-value | 0.049 | 0.045 | 0.392 | 0.444 | – | 0.405 | |
| ABTS | r-value | –0.723 | 0.829 | 0.956 | 0.715 | 0.805 | 1 |
| P-value | 0.824 | 0.378 | 0.189 | 0.493 | 0.405 | – |
*Correlation is significant at the 0.05 level (2-tailed).
r-value represents the Pearson’s correlation value.
TPC: total phenolic content; TFC: total flavonoid content; TAC: total anthocyanin content; DPPH: antioxidant activity by 2,2-diphenyl-1-picrylhydrazyl assay; ABTS: antioxidant activity by 2,2’-azino-bis(3-ethylbenzothiazoline-6-sulfonic acid.
In this study, the antioxidant activity losses were also deduced and were expressed as Trolox equivalent mg/g on dry basis. The results of the study are summarized in Table 8, which noted that the highest losses of antioxidant activity were in LV20 (66.35%), followed by AV20 (65.72%), LV16 (65.74%), AV16 (59.73%), LV8 (54.11%), AV8 (49.91%), and, finally, in EE (45.42%), although the values were not statistically significant. It was apparent that the Trolox content of all samples decreased over time, leading to a reduction in the percentage inhibition of samples evaluated by ABTS and DPPH. The trend shown in antioxidant activity (Trolox equivalent) followed the same as in TPC and TFC (Figures 4A and 4B), with the highest losses found in all CGA-processed samples. However, the trend was not similar to TAC, for which the highest losses were found in controlled sample (EE). This clearly indicated that phenolics and flavonoids present in BPF extract contributed to the antioxidant activity, rather than anthocyanin compounds. Another reason could be the stabilization effect provided by Tween-20, which protects anthocyanin from degradation. These results corroborated the findings of Tsai and Huang (2004), who suggested that despite heating and change in the degree of polymerization of anthocyanin, there was no significant difference in Trolox content in Roselle, suggesting that the ability of anthocyanins to quench ABTS+ radical was unaffected by the degree of polymerization in anthocyanins.
Table 8. Total of Trolox content during storage interval.
| Samples | Day 0 (mg Trolox/g) | Day 85 (mg Trolox/g) | Total loss (%) |
|---|---|---|---|
| EE | 193.73±20.50 | 105.73±10.33 | 45.42a |
| AV8 | 85.23±0.13 | 42.69±0.00 | 49.91a |
| LV8 | 72.69±8.60 | 33.36±0.00 | 54.11a |
| AV16 | 65.63±12.13 | 26.43±0.00 | 59.73a |
| LV16 | 59.23±0.00 | 20.29±0.00 | 65.74a |
| AV20 | 53.76±0.13 | 18.43±1.07 | 65.72a |
| LV20 | 46.03±7.00 | 15.49±0.53 | 66.35a |
EE: ethanolic extract; AV8: aphron phase with volumetric ratio 8; LV8: liquid phase with volumetric ratio 8; AV16: aphron phase with volumetric ratio 16; LV16: liquid phase with volumetric ratio 16; AV20: aphron phase with volumetric ratio 20; LV20: liquid phase with volumetric ratio 20.
Results were expressed as mean ± standard deviation.
Different superscripted lowercase letters show statistically significant differences between values (P < 0.05).
Particle size analysis
Tween-20 micelles characterization
The size of micelles was measured by using particle size analyzer. The size of Tween-20 micelles ranged from 8.07 nm to 8.57 nm, and there was no statistically significant difference (P < 0.05) between them as tabulated in Table 9. These findings were similar to another research, which found that the size of surfactin micelles from fermentation of broth by Bacillus subtilis was approximately 9 nm (Isa et al., 2007). In a previous study, Basheva et al. (2007) provided data on the sizes of micelles formed by Tween-20, with a concentration ranging from 80 millimolar (mM) to 200 mM, the mean diameter being 7.2 nm, whereas for nonionic hydrophilic surfactant Brij™35, the concentration ranged from 10 mM to 100 mM, with a mean diameter of 8.8 nm. Hence, it was clear that the size of micelles depended on the types and concentration of surfactants used.
Table 9. The size of Tween-20 micelles at different concentrations.
| Tween-20 concentration (mm) | Diameter (nm) |
|---|---|
| 6 | 8.57±0.15a |
| 8 | 8.44±0.33a |
| 10 | 8.07±0.42a |
Results were expressed as mean ± standard deviation.
Different superscripted lowercase letters show statistically significant differences between values (P < 0.05).
In the current study, the size of micelles obtained was inversely proportional to surfactant concentration (Table 9). The higher the concentration of Tween-20 used, the smaller the diameter of micelles obtained. The relationship may partly be explained by the fact that a higher surfactant concentration is able to offer stability against aggregation by rapidly coating the outer surface of newly formed elastic liposomes, preventing liposomes from enlarging into bigger sizes (Singh et al., 2016).
Determination of particle size in selected CGA phases
In this part of our research, for the determination of particle size in the CGA phases, only two volumetric ratios were selected based on their optimum storage stability (volumetric ratio 8 (least optimum) and volumetric ratio 20 (most optimum)). This selection was made based on the previous stabilization effect shown during storage. In Table 10, statistically significant differences in particle size were noted in LV20 for all samples, while AV8 did not show any statistically significant difference (P < 0.05), compared to LV8 and AV20. In order to understand and investigate the adsorption of anthocyanin compounds in CGA or micelles present in respective phases, ultrafiltration method with different sizes was conducted. Particle size is a vital parameter for portraying the characteristics of encapsulation, whereby the particle size of unencapsulated BPF (crude extract) was found ranging from 140 nm to 223 nm. On the other hand, Table 10 shows that the particle sizes of selected CGA fractions ranged from 284 nm to 423 nm, which demonstrated increment, compared to the crude extract. Therefore, it can be deduced that the presence of nanoparticles, for instance anthocyanins, may participate in the aggregation of molecules which led to the increment of particle size. Similar result was obtained by Isa et al. (2007), who conducted a study on the recovery and purification of surfactin produced by Bacillus subtilis from a complex of fermentation broths. It was found that broth conditions increased the size of micelles. This was probably due to the presence of organic compounds that may interact with micelles as well as other factors such as ionic strength, which increased micelles size.
Table 10. Particle size of encapsulated anthocyanin by Tween-20.
| Samples | Particle size (nm) |
|---|---|
| AV8 | 284.26±35.90b,c |
| LV8 | 314.46±19.50b |
| AV20 | 240.26±65.60c |
| LV20 | 422.81±170.00a |
EE: ethanolic extract; AV8: aphron phase with volumetric ratio 8; LV8: liquid phase with volumetric ratio 8; AV20: aphron phase with volumetric ratio 20; LV20: liquid phase with volumetric ratio 20.
Results were expressed as mean ± standard deviation.
Different superscripted lowercase letters show statistically significant differences between values (P < 0.05).
However, it was important to note that particle size of the aphron phase was consistently smaller than the liquid phase (Table 10). As reported by Szoll et al. (2023), when the particle size reduces, their surface area increases, facilitating stronger interaction with the solvent and leading to improved dissolution. This enhancement in solubility and dissolution of anthocyanins contribute to their overall stability. Consequently, it was evident that AV20 with its smaller particle size (240 nm) and higher solubility, exhibited the highest stability of anthocyanins compound, compared to other samples. Apart from this, it was hypothesized in this study that anthocyanin could potentially form aggregates with antioxidant compounds, specifically phenolic or/and flavonoid compounds, resulting in improved overall stability. This theory aligns with the study done by Remini et al. (2018), which observed that flavonols and flavones were commonly found in conjunction with anthocyanins in fruits and fruit juices, suggesting that the presence of flavonoid may contribute to the stabilization of anthocyanins.
The interaction between the surfactant and coexisted organic compounds, particularly anthocyanins, in the mediums increased the original micelles size obtained in this study. These results reflected those of Isa et al. (2007), who found that the micelle size seems to be slightly enlarged with a mean diameter of 100 nm in broth conditions; this could be explained by the presence of organic compounds that interact in micelles and the ionic strength thus increases its size. One interesting finding of Azad et al. (2018) was that among the formulations studied, the particle size of active compound from purple potato was found to be more than 1,000 nm in nonionic hydrophilic surfactant Brij™35. However, in our study, when a nonionic hydrophilic surfactant (Tween-20) was used, a smaller particle size (240–422 nm) encapsulating active compounds was observed in all samples. The hydrophile-lipophile balance (HLB) numbers of Tween-20 and Brij™35 were found to be 16.7 (Schmidts et al., 2012) and 16.9 (Sharma et al., 2015), respectively. According to Jiang (2018), a smaller HLB value indicated more lipophilic properties, while a larger HLB value indicated more hydrophilic properties. The difference in particle size observed may be attributed to the HLB value of surfactant, and this was confirmed by Yammine et al. (2015), who observed that the lower HLB value resulted in decreasing particle size. Therefore, selecting an appropriate HLB value of surfactant is required in order to control the size of particles.
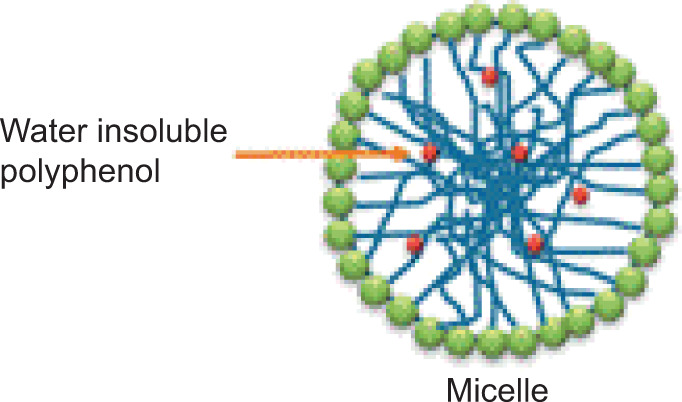
To the best of our knowledge, our results are explained by the hydrophobic and/or hydrophilic interactions that may occur between micelles and compounds. Tween-20 is a nonionic surfactant and, theoretically, a surfactant is able to form associate colloids called micelles when critical micellar concentration (CMC) is achieved. The core shell structures were in spherical shape with sizes ranging from 10 to 100 nm. The hydrophilic chains formed micelles crown, while the hydrophobic chains created the inner core. A cross-linking reaction typically occurs after the formation of micelles in order to increase the stability of structures (Parisi et al., 2014) (Figure 7). According to Azad et al. (2018), due to the amphiphilic nature of micelles, the polar and nonpolar matrix of compounds was dissolved. For instance, span 80, a nonionic surfactant, forms a chemical crosslink with polar and nonpolar molecules of polyphenol compounds, thus forming hydrogen bonds with one another.
Figure 7. Illustration of micelles (Adapted from Parisi et al., 2014).
From the results, it was found that the encapsulation efficiency and separation factor were linearly increased with increasing surfactant concentration (Table 11). Surfactant concentration may have an impact on the separation factor and encapsulation efficiency. It was interesting to highlight that separation factor corresponds to the affinity of compounds for aphron phase. As expected, volumetric ratio 20 gave a high separation factor, which showed high affinity of anthocyanins for aphron phase, compared to ratio 8, although there no statistically significant difference (P < 0.05) was noted between both samples (Table 11). In addition, encapsulation efficiency is inversely proportional to the initial volume feed and there was no statistically significant difference (P < 0.05) between both samples (Table 1). This result may be explained by the fact that phenolic compounds interact with CGA at lower levels, which led to the saturation of CGA with phenolic compounds (Dermiki et al., 2010), and the CGA dispersion may not provide enough surface area for adsorption when the initial concentration of feed is high (Hashim et al., 1995). Thus, it can be speculated that higher initial feed concentration may led to lower encapsulation efficiency.
Table 11. Separation factor and encapsulation efficiency of selected CGA samples.
| Samples | Estimated Tween-20 concentration |
Separation factor | Encapsulation efficiency (%) |
|---|---|---|---|
| AV8 | 6.57±0.03a | 1.10±0.09a | 70±8.83a |
| AV20 | 7.92±1.87a | 1.21±0.14a | 77±6.43a |
AV8: aphron phase with volumetric ratio 8; AV20: aphron phase with volumetric ratio 20.
Results were expressed as mean ± standard deviation.
Different superscripted letters show statistically significant differences between values (P < 0.05) among rows.
Other than this, it is very interesting to compare flow rate with separation factor. In our study, the flow rates for AV8 and AV20 were 178 mL/min and 190 mL/min, respectively. From these results, it can be concluded that separation factor also correlated linearly with flow rates. This would be in agreement with the study conducted by Dermiki et al. (2010), who found that with higher flow rates allowed, more bubbles were introduced to the flotation column, thus leading to a more interaction of compounds of interest with CGA. Additionally, Noriega et al. (2018) reported that the highest separation factor for compounds of interests (phenols, proteins, and sugar) was achieved for the highest volumetric ratios. As a result, it can be deduced that higher encapsulation efficiency was linearly correlated with surfactant concentration as well as CGA–anthocyanin volumetric ratios.
Microscopic analysis
The CGA microbubbles’ diameters of the treated samples (AV8 and AV20) were measured by using an optic microscopy. Figures 8A–8C showed the graphs of the size distribution of diameters of CGA microbubbles. The microbubbles’ size distribution was measured for at least 200 individual microbubbles using Mathlab R2022b.
Figure 8. (A) Size distributions of CGA microbubbles without BPF extract; (B) size distribution of CGA microbubbles of AV8; and (C) size distribution of CGA microbubbles of AV20.
In this study, the CGA microbubbles’ average diameters without samples and with samples (AV8 and AV20) are presented in Figure 8 and found to be (A) 54.26 µm, (B) 50.24 µm, and (C) 41.76 µm, respectively. Thus, these results were in line with the theory postulated by a previous study, which suggested that the diameter of microbubbles of CGA ranged between 10 µm and 100 µm (Jauregi et al., 1997). Further, the highest average diameter (50.24 µm) was found at a high surfactant concentration of AV20 (7.92 mM), compared to AV8 (6.57 mM; 41.76 µm). However, it is worth noting for all the selected CGA phases in this study, the addition of BPF extract showed a significant difference (P < 0.05) to the average diameter size of CGA within the resolution of optic microscopy (Table 12). This concludes that the addition of BPF extract and Tween-20 with different volumetric ratios (ranging from 8 to 20 [VCGA/VFeed]) may affect the average diameter of the microbubbles generated by CGA method.
Other authors also reported data on the average diameter of CGA microbubbles. For example, Larmignat et al. (2008) found that the surfactant concentration ranging from 4 mM to 17 mM exhibited an average diameter of CGA microbubbles ranging from 74 µm to 82 µm. This behavior may be attributed to a more stable CGA generated by increased surfactant concentration, which resulted in the formation of large bubbles on the surface and obscuring smaller bubbles (Larmignat et al., 2008). AV20 exhibited 1.20-fold increase in average diameter of CGA, compared to AV8. Owing to the limitation of the size of particles measurable under optic microscopy (measurable particle size > 0.2 µm), we postulated that this finding could be related to the coexistence of nanoparticles in CGA microbubbles that may enlarge the average diameter of CGA that cannot be measured or visible by optic microscopy.
The PDI was calculated by referring to Romoscanu et al. (2010), in which a monodisperse emulsion exhibited a uniformity value of less than 25%. In our study, the PDI (%) of CGA phases is demonstrated in Table 12. The CGA (control) and AV20 exhibit a polydisperse emulsion, while AV8 shows a monodisperse emulsion. It was found that the PDI ranged from 21% to 40%, with average CGA diameters ranging from 42 µm to 54 µm, and there was a statistically significant difference (P < 0.05) between both samples (Table 12). PDI describes the measurement of the size distribution of particles in a solution. The PDI value of AV8 was found to be 20.86%, which was lower compared to AV20 (28.18%). A lower PDI value resulted in a more homogenous particle size distribution. A possible explanation for this could be that higher concentrations of anthocyanins result in stronger interactions within polymers (Bulatao et al., 2017).
Table 12. CGA sizes of control and selected CGA phases.
| Sample | Diameter (µm) | Polydispersity index (PDI) (%) |
|---|---|---|
| CGA (control) | 54.26±21.49a | 39.61±0.00a |
| AV8 | 41.76±8.71c | 20.86±0.00c |
| AV20 | 50.24±14.16b | 28.18±0.00b |
Control: CGA without sample; AV8: aphron phase with volumetric ratio 8; AV208: aphron phase with volumetric ratio 20.
Results were expressed as mean ± standard deviation.
Different superscripted letters show statistically significant differences between values (P < 0.05).
Other than this, increased surfactant concentrations resulted in the increment of the average diameter of CGA (Table 12). In this case, CGA (control) showed a higher PDI (39.61%) with higher average diameters of particles (54.26 µm), although in the absence of bioactive compounds-enriched samples, probably due to the coalescence of smaller microbubbles which led to the formation of larger microbubbles. However, the average diameter of CGA is still within the range of theoretical values (10–100 µm). Further, for AV8 and AV20, reducing the surfactant concentration resulted to the reduction of average diameter of CGA while minimizing PDI (Table 12). However, it can be seen that the presence of nanoparticles, such as phenolic compounds as well as anthocyanins in AV8 and AV20, may lead to a good emulsification process, compared to CGA (control). This was confirmed by the reduction of PDI (Table 12), which was in agreement to a study done by Singh et al. (2016). The study concluded that reduction of PDI led to a good emulsification process because of the reduction of interfacial tension. To the best of our knowledge, the function of a surfactant in CGA is to stabilize the gas–liquid interface by reducing interfacial tension. For this reason, the polyphenolic compounds present in samples could be either polar or nonpolar in nature, as reported by Gümüş Yılmaz et al. (2019), contributed by the different functional groups. Thus, the amphiphilic nature of polyphenolic compounds enables them to act as surfactants or co-surfactants at gas–liquid interface. The molecular structure of these compounds, which contains both hydrophilic and hydrophobic regions, facilitating their adsorption at the CGA interface. The adsorption of these compounds, particularly anthocyanins and phenolic compounds at the CGA interface creates a barrier that prevents the coalescence and coagulation of CGAs, thereby leading to a more stable emulsion.
Conclusions
The results obtained in this research provided evidence on the presence of CGA that improved the stability of anthocyanins when stored at room temperature for 85 days. In long-term storage, V20 (AV20 and LV20) showed a much lower overall anthocyanin loss of 18.70% and 26.30%, respectively. Both samples were statistically different, compared to the controlled sample (EE), which showed a higher anthocyanins loss of 74.57%. Hence, this indicated that the anthocyanins extracted by CGA were more stable and this increased with the concentration of Tween-20. Different trends were noted on the TPC and TFC losses shown in AV20 (27.48% and 69.61%, respectively) and LV20 (30.16% and 70.95%, respectively). The presence of surfactant may not directly affect the stability of TPC and TFC purposely, but evidently had enhanced the stability of anthocyanins during the storage period. The stabilization mechanism of anthocyanins in the CGA-processed samples may still be unclear but could potentially be related to the solubilization effect between Tween-20 micelles and anthocyanins.
The diameter of Tween-20 micelles was between 8.1 nm and 8.6 nm. Obtained results showed that higher concentration of Tween-20 had the highest encapsulation efficiency and separation factor, and these may be driven by hydrophobic and/or hydrophilic interaction. Although the stabilization effect observed by CGA samples was not clearly understood, the findings would help for a better understanding of the proposed extraction method to enhance the storage stability of anthocyanins. Future studies are required to discover new methods for the encapsulation of the compounds of interests using surfactant as a medium of extraction.
Author Contributions
Tuan Nurul Maisarah: Conducted the experiments, collected and analyzed the data, and contributed to manuscript writing and revisions. Noorain Nasuha, Mohamad Khairi, Elham Taghavi & Masni: Participated in formatting the manuscript and revisions. Nur Suaidah & Paula Jauregi: Provided critical input in data interpretation, reviewed the manuscript for intellectual content, and contributed to finalizing the manuscript. Nurmahani: Supervised the study, provided resources and funding, and critically revised the manuscript for important intellectual content. All authors have read and approved the final manuscript.
Conflict of interest
There was no conflict of interest to declare.
Funding
This research was funded by Ministry of Higher Education (MOHE) Malaysia through the Fundamental Research Grant Scheme (FRGS/1/2024/STG04/UMT/02/2).
REFERENCES
Agbor, A.G., Vinson, J.A. and Donnelly, P.E., 2014. Folin–ciocalteau reagent for polyphenolic assay. International Journal of Food Science, Nutrition and Dietetics, 3(8): 147–156. 10.19070/2326-3350-1400028
Aksay, S., 2004. Effect of storage temperature on the stability of anthocyanins of a fermented black carrot (Daucus carota var. L.) beverage: shalgam. Journal of Agricultural and Food Chemistry 52(12): 3807–3813. 10.1021/jf049863s
Ali, A., Chong, C.H., Mah, S.H., Abdullah, L.C., Choong, T.S.Y. and Chua, B.L., 2018. Impact of storage conditions on the stability of predominant phenolic constituents and antioxidant activity of dried piper betle extracts. Molecules 23(2): 484–498. 10.3390/molecules23020484
Al-Snafi, A.E., 2016. Pharmacological importance of Clitoria ternatea–A review pharmacological importance of Clitoria ternatea–A review Prof Dr Ali Esmail Al-Snafi. IOSR Journal of Pharmacy 6(3): 68–83.
Amendola, D., De Faveri, D.M. and Spigno, G., 2010. Grape marc phenolics: extraction kinetics, quality and stability of extracts. Journal of Food Engineering 97(3): 384–392. 10.1016/j.jfoodeng.2009.10.033
Aryal, S., Baniya, M.K., Danekhu, K., Kunwar, P., Gurung, R. and Koirala, N., 2019. Total phenolic content, flavonoid content and antioxidant potential of wild vegetables from Western Nepal. Plants 8(4): 96–107. 10.3390/plants8040096
Azad, O.K., Lim, Y.S., Park, C.H. and Kang, W.S., 2018. Evaluation of anthocyanin stability in surfactant formulation from Extrudate purple potato (Solanum tuberosum L.). Journal of Food Processing and Technology 9(9): 1–5. 10.4172/2157-7110.1000750
Basheva, E.S., Kralchevsky, P.A., Danov, K.D., Ananthapadmanabhan, K.P. and Lips, A., 2007. The colloid structural forces as a tool for particle characterization and control of dispersion stability. Physical Chemistry Chemical Physics 9(38): 5183–5198. 10.1039/B705758J
Bulatao, R.M., Samin, J.P.A., Salazar, J.R. and Monserate, J.J., 2017. Encapsulation of anthocyanins from black rice (Oryza sativa L.) bran extract using chitosan-alginate nanoparticles. Journal of Food Research 6(3): 40–47. 10.5539/jfr.v6n3p40
Çam, M., İçyer, N.C. and Erdoğan, F., 2013. Pomegranate peel phenolics: microencapsulation, storage stability and potential ingredient for functional food development. LWT–Food Science and Technology 55(1): 117–123. 10.1016/j.lwt.2013.09.011
Carolina, M., Jesús, H, De Ernesto, J., Osorio, C. and Azucena, M., 2019. Encapsulated betalains (Opuntia ficus-indica) as natural colorants. Case study: gummy candies. LWT–Food Science and Technology 103: 222–227. 10.1016/j.lwt.2018.12.074
Charurungsipong, P., Tangduangdee, C., Amornraksa, S., Asavasanti, S. and Lin, J., 2020. Improvement of anthocyanin stability in butterfly pea flower extract by co-pigmentation with catechin. E3S Web of Conferences 141: 1–4. 10.1051/e3sconf/202014103008
Dahmoune, F., Madani, K., Jauregib, P., Faveri, D.M.De. and Spigno, G., 2013. Fractionation of a red grape marc extract by colloidal gas aphrons. Chemical Engineering Transactions 32: 1903–1908. 10.3303/CET1332318
Dai, Y. and Row, K.H., 2019. Application of natural deep eutectic solvents in the extraction of quercetin from vegetables. Molecules 24(12): 2300–2310. 10.3390/molecules24122300
David, L., Schill, K. and Nilsson, L., 2008. Flavonoids: precipitation kinetics and interaction with surfactant micelles. Journal of Food Science 76(3): 35–39. 10.1111/j.1750-3841.2011.02103.x
Dermiki, M., Bourquin, A.L. and Jauregi, P., 2010. Separation of astaxanthin from cells of Phaffia rhodozyma using colloidal gas aphrons in a flotation column. Biotechnology Progress 26(2): 477–487. 10.1002/btpr.340
Ezzudin, M., 2018. Mini review: a potential of telang tree (Clitoria ternatea) in human health. Food Research 2(5): 415–420. 10.26656/fr.2017.2(5).073
Free, M.L., 2008. The use of surfactants to enhance particle removal from surfaces. In: Kohli, R. and Mittal, K.L. (eds.) Developments in Surface Contamination and Cleaning. Vol. 1: Fundamentals and Applied Aspects. Elsevier, Amsterdam, The Netherlands, pp. 727–758. 10.1016/B978-081551555-5.50016-2
Fu, X., Wu, Q., Wang, J., Chen, Y., Zhu, G. and Zhu, Z., 2021. Spectral characteristic, storage stability and antioxidant properties of anthocyanin extracts from flowers of butterfly pea (Clitoria ternatea L.). Molecules 26(22): 7000–7011. 10.3390/molecules26227000
Fuda, E., Bhatia, D., Pyle, D.L. and Jauregi, P., 2005. Selective separation of β-lactoglobulin from sweet whey using CGAs generated from the cationic surfactant CTAB. Biotechnology and Bioengineering 90(5): 532–542. 10.1002/bit.20412
Galmarini, M.V., Maury, C., Mehinagic, E., Sanchez, V., Baeza, R.I., Mignot, S., Zamora, M.C. and Chirife, J., 2013. Stability of individual phenolic compounds and antioxidant activity during storage of a red wine powder. Food and Bioprocess Technology 6: 3585–3595. 10.1007/s11947-012-1035-y
González-Cruz, E. M., Andrade González, I., Prieto, C., Lagarón, J. M., Calderón Santoyo, M., and Ragazzo Sánchez, J. A. 2022. Nanoencapsulation of polyphenolic-rich extract from biloxi blueberries (Vaccinium Corymbosum L.) by electrospraying using Zein as encapsulating material. Biointerface Research in Applied Chemistry 13(1): 1–14. 10.33263/BRIAC131.078
Gümüş Yılmaz, G., Gómez Pinchetti, J.L., Cifuentes, A., Herrero, M. and Ibáñez, E., 2019. Comparison of extraction techniques and surfactants for the isolation of total polyphenols and phlorotannins from the brown algae Lobophora variegata. Analytical Letters 52(17): 2724–2740. 10.1080/00032719.2019.1597878
Hamzah, Y., Jumat, N.A. and Sembok, W.W., 2013. Effect of drying on the storage stability of encapsulated anthocyanins powder extract from Butterfly pea flower (Clitoria ternatea). In Proceedings of the 13th ASEAN Food Conference, September 9-11, 2013, Singapore, pp. 1–10.
Hansen, M. M., Hartel, R. W., & Roos, Y. H., 2021. Encapsulant-bioactives interactions impact on physico-chemical properties of concentrated dispersions. Journal of Food Engineering, 302, 110586.
Hashim, M.A., SenGupta, B. and Subramaniam, M.B., 1995. Investigations on the flotation of yeast cells by colloidal gas aphron (CGA) dispersions. Bioseparation 5(3): 167–173. 10.1007/BF00913664
Isa, M.H.M., Coraglia, D.E., Frazier, R.A. and Jauregi, P., 2007. Recovery and purification of surfactin from fermentation broth by a two-step ultrafiltration process. Journal of Membrane Science 296(1–2): 51–57. 10.1016/j.memsci.2007.03.023
Jaafar, N.F., Ramli, M.E. and Salleh, R.M., 2020. Optimum extraction condition of Clitorea ternatea flower on antioxidant activities, total phenolic, total flavonoid and total anthocyanin contents. Tropical Life Sciences Research 31(2): 1–17. 10.21315/tlsr2020.31.2.1
Jamille, F., Paes, D.F. and Clemente, H.A., 2020. Stability of encapsulated and non-encapsulated anthocyanin in yogurt produced with natural dye obtained from Solanum melongena L. Bark. Revista Brasileira de Fruticultura 42(3): 1–13. 10.1590/0100-29452020137
Jauregi, P., Gilmour, S. and Varley, J., 1997. Characterisation of colloidal gas aphrons for subsequent use for protein recovery. Chemical Engineering Journal 65(1): 1–11. 10.1016/S1385-8947(96)03154-3
Jiang, Y., 2018. Effect of surfactant HLB value on settlement stability of magnetorheological fluid. Open Access Library Journal 5(11): 1–6. 10.4236/oalib.1105004
Kafkas, N.E., Kosar, M., Öz, A.T. and Mitchell, A.E., 2018. Advanced analytical methods for phenolics in fruits. Journal of Food Quality 2018(1): 1–6. 10.1155/2018/3836064
Kallithraka, S., Salacha, M.I. and Tzourou, I., 2009. Changes in phenolic composition and antioxidant activity of white wine during bottle storage: accelerated browning test versus bottle storage. Food Chemistry 113(2): 500–505. 10.1016/j.foodchem.2008.07.083
Kazazic, M., Djapo, M. and Ademovic, E., 2016. Antioxidant activity of water extracts of some medicinal plants from Herzegovina region. International Journal of Pure & Applied Bioscience 4(2): 85–90. 10.18782/2320-7051.2251
Kotsiou, K. and Tasioula-Margari, M., 2016. Monitoring the phenolic compounds of Greek extra-virgin olive oils during storage. Food Chemistry 200: 255–262. 10.1016/j.foodchem.2015.12.090
Labiad, M.H., Harhar, H., Ghanimi, A. and Tabyaoui, M., 2017. Phytochemical screening and antioxidant activity of Moroccan Thymus satureioïdes extracts. Journal of Materials and Environmental Science 8(6): 2132–2139.
Larmignat, S., Vanderpool, D., Lai, H.K. and Pilon, L., 2008. Rheology of colloidal gas aphrons (microfoams). Colloids and Surfaces A: Physicochemical and Engineering Aspects 322(1–3): 199–210. 10.1016/j.colsurfa.2008.03.010
Lee, P.M., Abdullah, R. and Hung, L.K., 2011. Thermal degradation of blue anthocyanin extract of Clitoria ternatea flower. In Proceeding of the 2nd International Conference on Biotechnology and Food Science IPCBEE vol. 7, 2011, Singapore, pp. 49-53.
Lee, J., Durst, R.W. and Wrolstad, R.E., 2005. Determination of total monomeric anthocyanin pigment content of fruit juices, beverages, natural colorants, and wines by the pH differential method: collaborative study. Journal of AOAC International 88(5): 1269–1278. 10.1093/jaoac/88.5.1269
Lim, T.K., 2012. Edible Medicinal and Non-Medicinal Plants, (Vol. 1, pp. 656-687). Dordrecht, The Netherlands: Springer.
Looi, S.K., Zainol, M.K., Mohd, Z.Z., Hamzah, Y. and MohdMaidin, N., 2020. Antioxidant and antibacterial activities in the fruit peel, flesh and seed of Ceri Terengganu (Lepisanthes Alata leenh.). Food Research 4(5): 1600–1610. 10.26656/fr.2017.4(5).172
Lu, Q., Li, L., Xue, S., Yang, D. and Wang, S., 2019. Stability of flavonoid, carotenoid, soluble sugar and vitamin C in ‘Cara Cara’ juice during storage. Foods 8(9): 417–431. 10.3390/foods8090417
Madrona, G.S., 2020. Blackberry pomace microspheres: an approach on anthocyanin degradation. Science and Agrotechnology 44: e014420. 10.1590/1413-7054202044014420
Marpaung, A.M., Andarwulan, N. and Prangdimurti, E., 2012. The optimization of anthocyanin pigment extraction from butterfly pea (Clitoria ternatea L.) petal using response surface methodology. In proceeding of the Second Asia Pacific Symposium on Postharvest Research Education and Extension: APS20121011, 2012, Indonesia, pp. 205–211. 10.17660/ActaHortic.2013.1011.24
Marpaung, A.M, Lee, M. and Kartawiria, I.S., 2020. The development of butterfly pea (Clitoria ternatea) flower powder drink by co-crystallization. Indonesian Food Science and Technology Journal 3(2): 34–37. 10.22437/ifstj.v3i2.10185
Miyake, M. and Yamashita, Y., 2017. Molecular structure and phase behavior of surfactants. In: Cosmetic Science and Technology: Theoretical Principles and Applications. Sakamoto. K., Lochhead R.Y., Maibach, H. I., and Yamashita, Y. (Ed.), p.389-414. Elsevier, Amsterdam, The Netherlands.
MohdMaidin, N., Michael, N., Oruna-Concha, M.J. and Jauregi, P., 2018. Polyphenols extracted from red grape pomace by a surfactant based method show enhanced collagenase and elastase inhibitory activity. Journal of Chemical Technology and Biotechnology 93(7): 1916–1924. 10.1002/jctb.5459
MohdMaidin, N., Oruna-Concha, M.J. and Jauregi, P., 2019. Surfactant Tween-20 provides stabilisation effect on anthocyanins extracted from red grape pomace. Food Chemistry 271: 224–231. 10.1016/j.foodchem.2018.07.083
Muche, B.M., Speers, R.A. and Rupasinghe, H.P.V., 2018. Storage temperature impacts on anthocyanins degradation, color changes and haze development in juice of “Merlot” and “Ruby” grapes (Vitis vinifera). Frontiers in Nutrition 5: 1–9. 10.3389/fnut.2018.00100
Nakama, Y., 2017. Surfactants. In: Cosmetic Science and Technology: Theoretical Principles and Applications. Sakamoto. K., Lochhead R.Y., Maibach, H. I., and Yamashita, Y. (Ed.), p.231-244. Elsevier, Amsterdam, The Netherlands.
Noriega, D., Zuñiga, M.E., Soto, C., MohdMaidin, N., Michael, N. and Jauregi, P., 2018. Colloidal gas aphrons separation to obtain polyphenol rich fractions from artichoke agro-industrial discards. Food and Bioproducts Processing 110: 50–59. 10.1016/j.fbp.2018.04.007
Oguis, G.K., Gilding, E.K., Jackson, M.A. and Craik, D.J., 2019. Butterfly pea (Clitoria ternatea), a cyclotide-bearing plant with applications in agriculture and medicine. Frontiers in Plant Science 10: 645–667. 10.3389/fpls.2019.00645
Parisi, O.I., Puoci, F., Restuccia, D., Iemma, F. and Picci, N., 2014. Polyphenols and their formulations: different strategies to overcome the drawbacks associated with their poor stability and bioavailability. In: Polyphenols in Human Health and Disease. Watson R.R., Preedy V.R., and Zibadi, S. (Ed.), pp. 29–45. Elsevier, Amsterdam, The Netherlands.
Pham, T.N., Le, X.T., Nguyen, P.T.N., Tran, T.H., Dao, T.P., Nguyen, D.H., Danh, V.T. and Anh, H.L.T., 2020. Effects of storage conditions on total anthocyanin content of Butterfly pea flower (Clitoria ternatea L.). IOP Conference Series: Materials Science and Engineering 736: 1–7. 10.1088/1757-899X/736/6/062005
Piyarat, K., Walaisiri, M. and Pornpen, W., 2014. Comparison of stability of red colorants from natural sources, roselle and lac in micelles. International Food Research Journal. 21(1): 325–330.
Prado, A.S.L., Shen, Y., Ardoin, R., Osorio, L.F., Cardona, J., Xu, Z. and Prinyawiwatkul, W., 2018. Effects of different solvents on total phenolic and total anthocyanin contents of Clitoria ternatea L. petal and their anti-cholesterol oxidation capabilities. International Journal of Food Science & Technology 54(2): 424–431. 10.1111/ijfs.13953
Pu, L., Yu, H., Du, J., Zhang, Y. and Chen, S., 2020. Hydrotalcite–PLGA composite nanoparticles for loading and delivery of danshensu. RSC Advances 10(37): 22010–22018. 10.1039/D0RA01593H
Raja, B. and Pugalendi, K.V., 2010. Evaluation of antioxidant activity of Melothria maderaspatana in vitro. Central European Journal of Biology 5(2): 224–230. 10.2478/s11535-010-0001-2
Ravindran, P.N., 2017. The Encyclopedia of Herbs and Spices. CABI, Wallingford, UK.
Recamales, Á.F., Sayago, A., González-Miret, M.L. and Hernanz, D., 2006. The effect of time and storage conditions on the phenolic composition and colour of white wine. Food Research International 39(2): 220–229. 10.1016/j.foodres.2005.07.009
Remini, H., Dahmoune, F., Sahraoui, Y. and Madani, K., 2018. Recent advances on stability of anthocyanins. RUDN Journal of Agronomy and Animal Industries 13(4): 257–286. 10.22363/2312-797X-2018-13-4-294-302
Rocha-Parra, D., Rocha-Parra, D.F., Cecilia, M. and Clara, M., 2017. Influence of storage conditions on phenolic compounds stability, antioxidant capacity and colour of freeze-dried encapsulated red wine. LWT–Food Science and Technology 70: 162–170. 10.1016/j.lwt.2016.02.038
Romoscanu, A.I., Fenollosa, A., Acquistapace, S., Gunes, D., Martins-deuchande, T., Clausen, P., Mezzenga, R., Nyd, M., Zick, K. and Hughes, E., 2010. Structure, diffusion, and permeability of protein-stabilized monodispersed oil in water emulsions and their gels : a self-diffusion NMR study. Langmuir 26(9): 6184–6192. 10.1021/la100774q
Rosen, M.J., 2004. “Surfactants and interfacial phenomena” 3rd Ed. John Wiley & Sons, Inc., Hoboken, New Jersey.
Schmidts, T., Schlupp, P., Gross, A., Dobler, D. and Runkel, F., 2012. Required HLB determination of some pharmaceutical oils in submicron emulsions. Journal of Dispersion Science and Technology 33(6): 816–820. 10.1080/01932691.2011.584800
Sharma, S., Kori, S. and Parmar, A., 2015. Surfactant mediated extraction of total phenolic contents (TPC) and antioxidants from fruits juices. Food Chemistry 185: 284–288. 10.1016/j.foodchem.2015.03.106
Singh, S., Vardhan, H., Kotla, N.G., Maddiboyina, B., Sharma, D. and Webster, T.J., 2016. The role of surfactants in the formulation of elastic liposomal gels containing a synthetic opioid analgesic. International Journal of Nanomedicine Volume 11: 1475–1482. 10.2147/IJN.S100253
Siti Azima, A.M., Noriham, A. and Manshoor, N., 2014. Anthocyanin content in relation to the antioxidant activity and colour properties of Garcinia mangostana peel, Syzigium cumini and Clitoria ternatea extracts. International Food Research Journal 21(6): 2369–2375.
Skrypnik, L. and Novikova, A., 2020. Response surface modelling and optimization of polyphenols extraction from Apple Pomace based on nonionic emulsifiers. Agronomy 10(1): 92–111. 10.3390/agronomy10010092
Spigno, G. and Jauregi, P., 2005. Recovery of gallic acid with colloidal gas aphrons (CGA). International Journal of Food Engineering 1(4): 1–12. 10.2202/1556-3758.1038
Szoll, R., Szabina, K., Ambrus, R., Bartos, C. and Balogh, E., 2023. The effect of particle size reduction on the biorelevant solubility and dissolution of poorly soluble drugs with different acid-base character. Pharmaceutics 15(1): 278–292. 10.3390/pharmaceutics15010278
Tolun, A., Artik, N. and Altintas, Z., 2020. Effect of different microencapsulating materials and relative humidities on storage stability of microencapsulated grape pomace extract. Food Chemistry 302: 1–10. 10.1016/j.foodchem.2019.125347
Torres, J.A., Chagas, P.M.B., Silva, M.C., Dos Santos, C.D. and Corrêa, A.D., 2016. Evaluation of the protective effect of chemical additives in the oxidation of phenolic compounds catalysed by peroxidase. Environmental Technology 37(10): 1288–1295. 10.1080/09593330.2015.1112433
Tsai, P. and Huang, H., 2004. Effect of polymerization on the antioxidant capacity of anthocyanins in Roselle. Food Research International 37(4): 313–318. 10.1016/j.foodres.2003.12.007
Tuan Putra, T.N.M., Zainol, M.K., MohdIsa, N.S. and MohdMaidin, N., 2021. Chemical characterization of ethanolic extract of Butterfly pea flower (Clitoria ternatea). Food Research 5(4): 127–134. 10.26656/fr.2017.5(4).744
Wong, S.P., Leong, L.P. and William Koh, J.H., 2006. Antioxidant activities of aqueous extracts of selected plants. Food Chemistry 99(4): 775–783. 10.1016/j.foodchem.2005.07.058
Wu, H.Y., Yang, K.M. and Chiang, P.Y., 2018. Roselle anthocyanins: antioxidant properties and stability to heat and pH. Molecules 23(6): 1357–1370. 10.3390/molecules23061357
Yammine, P., Maarawi, T., Moussa, D., Abdel-Massih, R. and Kassab, R., 2015. Effects of different surfactants on indomethacin microspheres formulations. Journal of Advances in Chemistry 11(4): 3453–3462.