
Download
DPPH scavenging activity % = A c − A s A c × 100
ORIGINAL ARTICLE
Effects of probiotic cultures on bioactive peptides, composition, and sensory traits of yogurt
Muhammad Azhar Iqbal1, Mian Anjum Murtaza1, Aysha Sameen2, Iram Hafiz3*, Muhammad Yousaf Quddoos1*, Amanullah Sabir4, Tawfiq Alsulami5*
1Institute of Food Science and Nutrition, University of Sargodha, Sargodha 40100, Pakistan;
2Department of Food Science and Technology, Government College Women University Faisalabad-38000, Pakistan;
3Institute of Chemistry, University of Sargodha, Sargodha 40100, Pakistan;
4Guangdong Provincial Key Laboratory of Aquatic Product Processing and Safety, College of Food Science and Technology, Guangdong Ocean University, Zhanjiang. China;
5Department of Food Science & Nutrition, College of Food and Agricultural Sciences, King Saud University, Riyadh 11451, Saudi Arabia
Abstract
Milk proteins include many bioactive peptides (α-, β-, γ-, and κ-casein) with different therapeutic effects. This study aimed to evaluate the effects of different probiotic cultures on proximate composition, organic acids, quantitative analysis, proteolysis, bioactivities, and sensory attributes. Probiotic yogurt was prepared using a starter and probiotic bacteria (CHR-Hansen, Denmark) in combination with a standard protocol with slight modifications. It was stored at 6–8°C for 21 days. Results indicated that probiotic culture and storage significantly impacted the moisture, ash, protein, citric acid, and lactic acid composition of yogurt during storage. Regarding proximate parameters, maximum moisture, fat, protein, acetic acid, citric acid (treatments-wise), and sensory attributes were found in the following treatments (T): T5 (84.78±1.44%), T7 (4.69±0.05%), T7 (4.99±0.04%), T6 (109.26±0.73 ppm), T6 (377.81±6.57 ppm), and T6 (4.58±0.33%) by sequence during storage of 21 days. Probiotic cultures examined in this research possessed the capacity to enhance technological aspects and flavor profile of probiotic yogurt.
Key words: HPLC, organic acid, bioactive component, antioxidant, antihypertensive, proteolysis
*Corresponding Authors: Mian Anjum Murtaza: Institute of Food Science and Nutrition, University of Sargodha, Sargodha 40100, Pakistan. Email: [email protected]; Muhammad Yousaf Quddoos Institute of Food Science and Nutrition, University of Sargodha, Sargodha 40100, Pakistan. Email: [email protected]; Tawfiq Alsulami, Department of Food Science & Nutrition, College of Food and Agricultural Sciences, King Saud University, Riyadh 11451, Saudi Arabia: Email: [email protected]
Academic Editor: Carlos A.F. Oliveira, PhD, Department of Food Engineering, School of Animal Science and Food Engineering, University of São Paulo, Brazil
Received: 8 October 2024; Accepted: 11 March 2025; Published: 1 July 2025
© 2025 Codon Publications
This is an Open Access article distributed under the terms of the Creative Commons Attribution-NonCommercial-ShareAlike 4.0 International (CC BY-NC-SA 4.0). License (http://creativecommons.org/licenses/by-nc-sa/4.0/)
Introduction
A lacteal secretion produced by the mammary glands of mammals is milk (Kalita et al., 2025). In Pakistan, the main milk-producing animals include sheep, goats, camels, cows, and buffalo. In terms of global milk production, Pakistan is placed at fourth place. In the fiscal year 2016–2017, the gross annual production of milk was projected around 56.08 million tons (Government of Pakistan (GOP), 2021).
The highest produced milk was the buffalo milk, with a production of about 34.12 million tons. Cows produce about 20.14 million tons of milk annually, which is still a small amount when compared to buffalo milk (GOP, 2021).
The nutritional value of milk is correlated with its chemical constitution. Regarding milk composition, 3.5% of milk comprises proteins, 80% of which are casein and 20% are whey. There are three types of α-, β-, and κ-caseins. Whey contains b-lactoglobulin, α-lactalbumin, and countless other small proteins with a variety of biological properties, such as the ability to bind enzymatically minerals and to have an immunological effect (Ren et al., 2024).
With a proline residue at the carboxyl-terminal end, the angiotensin-converting enzyme (ACE)-inhibitory peptides are known to withstand digestion by digestive enzymes, enter the bloodstream as tiny sequence peptides, and travel straight to the small intestine. ACE is recognized for its ability to regulate peripheral blood pressure and is a crucial component of the renin-angiotensin system (RAS) (Minj and Vij, 2025).
In vitro chemical, in vitro cellular, and in vivo animal approaches are the three primary categories to assess antioxidant activity. Xu et al. (2024) characterized the biological impacts of these three techniques by including the scavenging of free radicals, chelation of metal ions, inhibition of lipid peroxidation, inhibition of oxidative enzyme activities, and activation of antioxidant enzymes and non-enzymatic systems. Exchange in lifestyle, nutritional modification, and physical workout are the key components to deal with diabetes without impacting any pharmacological drug. High fiber weight-reduction plan, food regimen low in saturated fat, intake of lactobacilli, and the overall low carbohydrate diet therapies are beneficial to attenuate blood glucose degree (Tahir et al., 2023).
Mammals are evolved to produce milk to serve as the source of nutrients needed for the growth and development of newborns. Milk contains a range of physiologically active compounds, including bioactive proteins, in addition to necessary nutrients, for newborn’s health. Peptides with a range of applications, including antioxidant qualities, are released when these milk proteins are degraded by enzymes during digestion, processing, or fermentation (such as the production of cheese) (Amigo et al., 2020).
According to Robinson et al. (2021), human milk contains hundreds to thousands of peptides produced by milk proteins in the mammary gland, which are also present in cheese and yogurt, among other dairy products. After consumption, the human milk’s proteins are further broken down into smaller bits and peptides in the stomach and intestines. Some peptides present in the human milk are excreted through newborn’s feces (Beverly et al., 2020). We should increase the utilization of of Ca in our white flour through organic source like egg shell, while our dairy product intake is less than required values.in this way we can overcome Ca deficiency diseases. (Quddoos et al., 2022).
The biological significance of peptides produced from milk proteins in different products and at different sites of digestion should be understood by comparing peptidomics data of a library of known bioactive peptides (BPs). Nielsen et al. (2024) point out that the creation of the Milk Bioactive Peptide Database (MBPDB) established this kind of research possible. The first published MBPDB contained 737 unique peptide sequence-function pairs. It included 606 unique peptide sequences from the milk of 10 different animals. Using the MBPDB, researchers discovered hundred more peptides in the human milk and infant formula. These peptides were very similar to the known bioactive milk peptides. They also discovered these peptides in the stomach and intestinal contents of babies as well as in their poop after they consumed human milk (Nielsen et al. 2020).
Dormant in their parent protein chains, bioactive peptides become active when enzymes and microbes break down these sequences. However, partial hydrolysis and the availability of raw materials restrict the utilization of enzymatic hydrolysis. Bioactive peptides are inactive within the parent protein’s sequence and can be released in three ways: (i) by digestive enzymes hydrolyzing the protein, (ii) by proteolytic microorganisms hydrolyzing the protein, and (iii) by proteolytic enzymes derived from plants or microorganisms (Hong et al., 2025). Among the various types of peptides are those that are antihypertensive, antioxidant, antithrombotic, hypocholesterolemic, opioid, anti-appetizing, antimicrobial, immunomodulatory, cytomodulatory, mineral binding, cholesterol-reducing effects, essential for human health. Whey proteins are used to make a variety of bioactive peptides as they contain various discerned bioactive peptides, such as lactoferricin, albutensin A, serorphin, β-lactotensin, β-lactorphin, and α-lactorphin (César et al., 2024).
Streptococcus thermophilus and Lactobacillus delbrueckii, subsp. bulgaricus, the two specialized lactic acid-producing bacteria, are cultured in milk to produce yogurt under controlled environmental conditions (Abedin et al., 2024). People use yogurt because it has health benefits. The immune system, metabolism, mental health, and digestive health are benefited from functional yogurt. As per the recommended daily allowance (RDA), yogurt contains between 30% and 45% phosphorus and 40% calcium per serving. Yogurt contains various amino acids, but glycine and proline are particularly significant. Because milk has a high protein content, yogurt is thought to have a positive biological value. Both gastrointestinal (GI) motility and performance of the immune system are enhanced by yogurt. Yogurt contains peptides and proteins that improve physiological activity of the human body, along with minerals (calcium and phosphorus), proteins, carbohydrates, vitamins (cobalamin, folate, niacin, riboflavin, vitamin A, and thiamine), and other nutrients (Pannerchelvan et al., 2024). The microbial communities that inhabit the vagina of wholesome reproductive age women typically incorporate high proportions of Lactobacillus spp., which are ruled by Lactobacillus iners, Lactobacillus crispatus, Lactobacillus gasseri, and Lactobacillus jensenii (Altaf et al., 2022). The body’s cholesterol level and lipid profile are reduced by lactic acid bacteria (LAB; Saeed et al., 2023). The pH of yogurt varies between 4.4 and 4.6. Numerous factors contribute to the sourness of yogurt. For instance, if the pH is low (4.4), it indicates that the milk used to make yogurt is of inferior quality and the starter culture is likewise tainted. The culture of Lactobacillus delbrueckii subsp. bulgaricus is also responsible for the bitter flavor of yogurt. Because it lowers the pH of milk, lactic acid is advantageous for producing yogurt (Ikram et al., 2021). Yogurt’s thermophilic culture, which grows at 40–45°C, causes acidity and fermentation of milk. The required ingredients to prepare yogurt are 8.25% milk solids, 3.25% milk fat, and a titrable acidity of at least 0.9% (Sionek et al., 2024).
Functional foods offer several fitness benefits, together with the prevention and remedy to illnesses, and a way to the purposeful food bioactive additives together with flavonoids, polyphenols, saponins, prebiotics, and natural sulfides (Zerlasht et al., 2024). Probiotic-containing dairy products are known to be beneficial for human health because they treat a wide range of physical abnormalities and illnesses. Probiotic dairy products enhance immune system performance and vaginal microbiota. Additionally, it decreases lactose intolerance and elevated blood cholesterol levels (Pannerchelvan et al., 2024). More than 500 distinct types of bacteria have positive functions in the human digestive system. As we get older (aged), fewer bacteria are present, making other microorganisms more potent immune system attackers (Keresztény et al., 2024).
The aim of this study was to evaluate the effects of different probiotic cultures on the physiochemical composition, organic acids, and sensory attributes of proteolytic peptide during the production and preservation of yogurt.
Materials and Methods
Raw milk collection
Raw buffalo and cow milk were procured from local dairy farms in the Sargodha region of Pakistan for preparing probiotic yogurt.
Starter cultures
Yogurt starter cultures (Streptococcus thermophilus and Lactobacillus delbrueckii subsp. bulgaricus) and probiotic cultures (Lactobacillus acidophilus and Bifidobacterium bifidum animalis subsp. lactis) of Chr. Hansen, Denmark, were purchased from scientific stores.
The starter culture should be kept in a freezer at –18°C (0°F) as soon as it is received. To prepare a starting culture for making yogurt, starter culture was defrosted for a few hours at room temperature (20–25°C). Then it was rehydrated for 30 min–1 h at room temperature by combining it with a small amount of sterile milk, as directed by the manufacturer. In order to prepare milk, it was heated to an appropriate temperature (often between 85°C and 90°C) and then cooled to inoculation temperature (about 40–45°C). To inoculate milk, the activated starting culture was added to the chilled milk and stirred gently. Then the infected milk was stored at a warm and draft-free area (around 40–45°C) and let it incubate for 4–8 h.
Probiotic yogurt preparation and storage
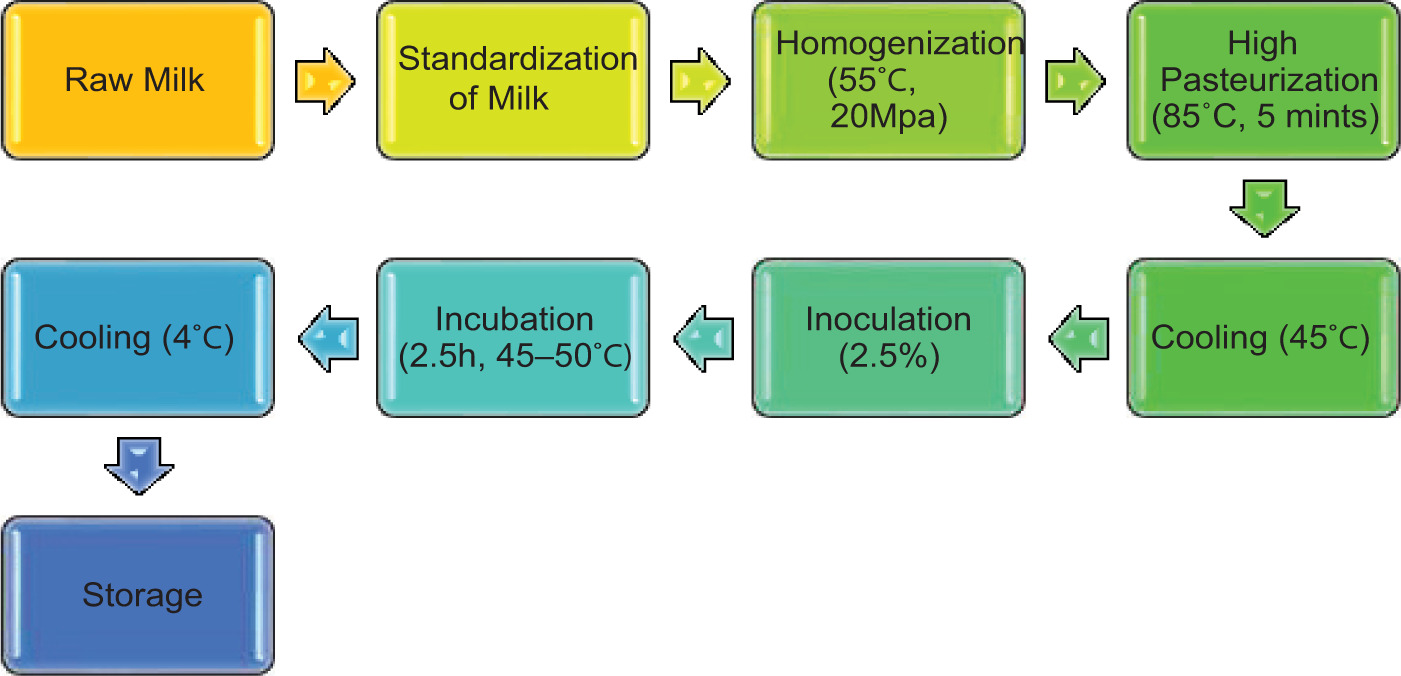
Probiotic yogurt was prepared using starter and probiotic bacteria by following the standard protocol with slight modifications as described by Cai et al. (2024); Dan et al. (2023); and Yang and Yoon (2022). It was stored at 6–8°C for 21 days. A detailed treatment plan for preparing yogurt is provided in Table 1, and was prepared according to the steps shown in Figure 1.
Figure 1. Steps for preparing yoghurt with specifications.
Table 1. Detailed treatment plan for yogurt manufacturing.
| Cow milk | T1 | C (Control) | Streptococcus thermophilus + Lactobacillus delbrueckii subsp. bulgaricus |
| T2 | C + BF | Streptococcus thermophilus + Lactobacillus delbrueckii subsp. bulgaricus+ Bifidobacterium bifidum | |
| T3 | C + LA | Streptococcus thermophilus + Lactobacillus delbrueckii subsp. bulgaricus + Lactobacillus acidophilus | |
| T4 | C + BF + LA | Streptococcus thermophilus + Lactobacillus delbrueckii subsp . bulgaricus + Bifidobacterium bifidum + Lactobacillus acidophilus | |
| Buffalo milk | T5 | C (control) | Streptococcus thermophilus + Lactobacillus delbrueckii subsp . bulgaricus |
| T6 | C + BF | Streptococcus thermophilus + Lactobacillus delbrueckii subsp . bulgaricus + Bifidobacterium bifidum | |
| T7 | C + LA | Streptococcus thermophilus + Lactobacillus delbrueckii subsp. bulgaricus + Lactobacillus acidophilus | |
| T8 | C + BF + LA | Streptococcus thermophilous + Lactobacillus delbrueckii subsp . bulgaricus + Bifidobacterium bifidum + Lactobacillus acidophilus |
LA: lactic acid fermentation; BF: bacterial cultures; C: control sample.
Proximate and physicochemical analyses
All yogurt treatments were analyzed for compositional analyses (moisture, fat, protein, and ash content), pH, and acidity at intervals of 7, 14, and 21 days during storage following the standard procedures of American Association of Cereal Chemists (AACC, 2000) and Association of Official Analytical Chemists (AOAC, 2006).
A drying oven with natural convection (Model: ED–115; Binder, Germany) was used to determine the moisture content of all yogurt treatments by the method described in AACC (2000). Crude protein content in all treatments of yogurt was determined by following Method No. 46–30 of AACC (2000) by using Kjeldhal’s apparatus (Model No: LBS-KDDC-3, Labsol enterprises, unit no 105, tower 2, DLF Corporate, Gurugram - 122004, Haryana, India). Crude fat content in all treatments of yogurt was determined by following the procedure described in Method No. 30–25 of AACC (2000) by using Soxhlet’s apparatus (Model No: Z556203. Sigma-Aldrich, Merck SA, an affiliate of Merck KGaA, Darmstadt, Germany). A pH meter (CPH-102; Contech, India) was used to measure pH values of each yogurt sample. All measurements of the samples were conducted in duplicate (AOAC, 2006).
Determination of organic acids
For 21 days, probiotic yogurt’s organic acids (acetic, lactic, and citric acids) were measured at different intervals (day 7, 14, and 21). With some modifications, the approach outlined by Akalin et al. (2002) was used to measure organic acids. This was accomplished by the use of high-performance liquid chromatography (HPLC). Aqueous 0.5% (wt/vol) (NH4)2HPO4 (0.038 M) – 0.2% (vol/vol) acetonitrile (0.049 M) adjusted to pH 2.24 with H3PO4 was combined with 7 g of grated probiotic yogurt sample. About 1 h was needed to remove the material. The extraction process was agitated using a shaker (T18 Basic, JK Ultra Turrax IKA-Werke GmbH & Co. KG, Janke & Kunkel-Str. 1079219,Staufen, Germany). The sample was centrifuged at 6,000 rpm for 5 min. The supernatant was filtered using Whatman filter No. 01. A 0.45-µm was used for second filtration. The filtrate was prepared for HPLC analysis. A Shimadzu liquid chromatograph (LC-10 AT VP Series, Shimadzu Corporation, Japan) was equipped with a SCL-10AVP framework processor. Both 20-µL test circle and SPD-10AVP UV-VIS indicator were added to chromatograph injector. At 214 nm, the detector was set up to detect organic acids.
Finding bioactive peptides
Relevant peptides were extracted from probiotic yogurt samples after 7, 14, and 21 days, and their corresponding bioactivities were examined. Kuchroo and Fox’s (1982) acid coagulation process was used to identify bioactive peptides.
Purification of peptides
The extracted peptides were purified using RP-HPLC by using the procedure described by Ong and Shah (2008).
In vitro bioactivity determination
The corresponding bioactivities of purified peptides were examined.
Antihypertensive activity of peptides
The antihypertensive action of peptides was assessed using the spectrophotometric method described by Borges et al. (1971). The spectrophotometric technique was applied based on the liberation of hippuric acid from hippuryl-L-histidyl-L-leuciyne (HHL), which was catalyzed by ACE. To assess in vitro ACE-inhibitory activity, samples of a predetermined volume (20 μL) were combined with 100 μL of buffered substrate solution at an operating temperature of 37°C.
Then the reaction mixture was added to 5-mM hippuryl-L-histidyl-L-leucine (Sigma-Aldrich, MO, USA) in 50-mM HEPES-HCl buffer containing 300-mM NaCl, exhibiting a pH of 8.3. About 40 μL of ACE (0.1 U/mL) (obtained from rabbit lung and supplied by Sigma-Aldrich) was added for carrying out the reaction, followed by incubation at 37°C for 30 min. After completion of the reaction, about 150 μL of 1-M HCl was added. The reaction led to the release of heptylic acid, which was further extracted with ethyl acetate (1 mL), followed by transference of organic phase to a glass tube and subjected to pyrolysis. The dissolution of the residue was performed in distilled water (800 μL) and was further subjected to spectrophotometric determination of absorbance wavelength at 228 nm; the results were reported in terms of percentage ACE-inhibitory activity (ACEI) using the following formula:
where A is the absorbance without water-soluble extract (WSE), and B is the represented absorbance without ACE. Conversely, C is indicative of absorbance in the presence of both ACE and WSE. The WSE activity from yogurt was also expressed in terms of the concentration of protein needed for inhibition (IC 50 value) of 50% of ACE activity. Captopril (1 mM; Sigma-Aldrich) was employed as a positive ACE-inhibitor control in this spectrophotometric measurement.
Antioxidant activity of peptides
The antioxidant activity of peptides was determined by the method reported by Apostolidis et al. (2007) using the 2,2-diphenyl-1-picrylhydrazyl (DPPH)-radical scavenging spectrophotometric assay at 517 nm with some modifications. In brief, 1-mL aliquots at varying concentrations of WSP extract (250, 500, 750 µg/mL) were taken in test tubes and subjected to mixing with freshly prepared DPPH (1 mL: 60 µM) methanol solution, followed by homogenization. After completion of 45-min incubation period under darkness, the absorbance was measured by employing a spectrophotometer (Elx 800 TM Absorbance Microplate Reader; BioTek Instrument, VT, USA) at a detection wavelength of 517 nm. Similarly, about 1 mL of distilled water was employed as a blank, and results were calculated using Equation (4) given below:
Where
As = sample’s absorbance,
Ac = absorbance of the blank.
Proteolysis assessment
Using HPLC, as described by Rulikowska et al. (2013), the proteolysis process in probiotic yogurt was assessed at different storage intervals. To separate fat, a 5-g sample was homogenized in 20 mL of 0.1-M citrate buffer (pH 3.6) at 40°C for 1 h. The suspension was centrifuged for 30 min at 3,000× g at 4°C. A disassociating solution (5 mL) was used to dissociate about 100 mg of the resulting pellet, which was gently and periodically mixed in a water bath at 40°C for 1 h. A 0.45-mm nylon syringe filter was utilized for the filtration process after the mixture was centrifuged once again for 10 min at 20,000× g at room temperature. With an ultraviolet (UV) visible detector (Shimadzu Corporation, Kyoto, Japan) set at 214 nm, a 20-mL aliquot was placed into a Shimadzu liquid chromatograph (LC-VP Series 10 AT; Shimadzu Corporation, Kyoto, Japan). For complete separation, two gradients of mobile phases were prepared: (a) 10% acetonitrile + 0.1% trifluoroacetic acid and 90% water; and (b) 10% water + 0.1% trifluoroacetic acid and 90% acetonitrile at a flow rate of 0.8 mL/min. The gradient was sustained at 20% A for 3 min after being lowered from 75% A (12 min) to 51% A (31 min), then to 20% A (13 min). After increasing the gradient to 75% A for 3 min, the entire running duration (54 min) was maintained at this concentration for 2 min. We determined the amount of water-soluble nitrogen (WSN) and total free amino acids (FAA).
Sensory evaluation
The present study used a descriptive sensory evaluation technique to evaluate probiotic yogurt’s sensorial parameters, such as color, taste, odor, sourness, consistency, appearance, and general acceptability. All treatments of yogurt were examined for sensory parameters by a panel of evaluators during storage by a method carried out by Murtaza et al. (2013). Among students and employees of the University of Sargodha, Pakistan, 25 evaluators, aged 18–60 years, were selected. A combined acceptance preference test by using a 9-point Hedonic scale, comprising 1 (‘I disliked very much’) to 9 (‘I liked very much’), was applied. Each evaluator was provided with samples packed in coded packets distributed in a balanced and randomized manner along with a glass of water.
Statistical analysis
Analysis of variance and completely randomized design (CRD) were used to collect data, and One-Way Analysis of Variance (ANOVA) was used to analyze the results. The paired t-test was used to measure differences between mean values, and significance was noted at P < 0.05. Mean ± standard deviation (SD) for three replicates (n = 3) was used to express all of the acquired results (Montgomery, 2008).
Results and Discussions
Proximate and physicochemical analyses
All samples of yogurt were analyzed for their moisture content at different intervals of storage. Statistical findings showed that probiotic cultures and storage significantly impacted the moisture content of yogurt (Table 2). The highest moisture content was observed in T5 (84.78±1.44%), and the lowest was in T1 (84.23±1.0%) on 0 day. During storage, the treatments showed minor alterations in moisture content, the moisture content of probiotic yogurt reduced from 84.78±1.44% to 84.12±1.46%, and moisture values for probiotic yogurt decreased as water evaporated for several days of storage. All interventions yielded statistically significant outcomes (P < 0.05), as there was a consistent reduction in moisture content. The trend of decreasing moisture content during storage was also identified in a study conducted by Terpiłowski et al. (2023), which examined how storage conditions affected the physicochemical characteristics of yogurt. The moisture levels and other physical and chemical properties of the final yogurt didn’t change much when researchers kept starter cultures at 5°C for up to 8 weeks. This finding matched what we already know: both type of probiotic culture and proper cold storage helped to keep yogurt’s moisture stable over time. In a different study, Ranok et al. (2021) looked at how whey protein concentrate (WPC) affected probiotic yogurt. The authors kept the moisture at the same level, but found that adding WPC boosted probiotics’ survival and yogurt’s ability to fight off oxidation during storage. So, as WPC, it can make yogurt more nutritious without messing up how well it keeps its moisture when stored in a fridge.
Table 2. Effect of probiotic cultures and days on moisture content (%).
| Treatments | Storage days | |||
|---|---|---|---|---|
| 0 | 7 | 14 | 21 | |
| T1 | 84.23±1.00a | 84.21±1.43a | 84.15±1.44a | 84.12±1.46a |
| T2 | 84.45±1.47a | 84.43±1.43a | 84.39±1.43a | 84.32±1.44a |
| T3 | 84.46±1.44a | 84.44±1.45a | 84.4±1.45a | 84.33±1.45a |
| T4 | 84.46±1.45a | 84.44±1.44a | 84.4±1.44a | 84.33±1.45a |
| T5 | 84.78±1.44a | 84.75±1.43a | 84.69±1.44a | 84.66±1.46a |
| T6 | 83.98±1.47a | 83.96±1.71a | 83.9±1.71a | 83.83±1.72a |
| T7 | 83.98±1.72a | 83.95±1.73a | 83.92±1.73a | 83.85±1.74a |
| T8 | 83.98±1.73a | 83.95±1.72a | 83.91±1.72a | 83.84±1.73a |
Mean values are displayed as mean ± standard deviation (SD) and reflect the outcome of three replications (n = 3). This indicates that there are substantial differences (P < 0.05) between the same superscript letters (a–d) in the column.
Protein
Table 3 shows the protein content of yogurts made with different probiotic cultures and storage periods. On day 0, each treatment had a different protein content. Treatments T6–T8 had higher protein content (4.98–4.9%) than treatments T1–T4 (3.9–4.12%). Protein content decreased as storage time increased for all treatments. The decrease was more pronounced in cow milk-based yogurts, while buffalo milk-based yogurts had higher protein content throughout the storage period.
Table 3. Effect of probiotic cultures and days on protein content (%).
| Treatments | Storage days | |||
|---|---|---|---|---|
| 0 | 7 | 14 | 21 | |
| T1 | 3.9±0.01j,k | 3.86±0.05k | 3.82±0.05k | 3.78±0.03k |
| T2 | 4.12±0.03g | 4.1±0.06g–i | 4.05±0.06g–i | 3.98±0.04i,j |
| T3 | 4.12±0.03g | 4.1±0.03g,h | 4.07±0.04g–i | 4±0.04h–j |
| T4 | 4.12±0.02g | 4.1±0.04g,h | 4.06±0.05g–i | 3.99±0.04h–j |
| T5 | 4.45±0.02e | 4.41±0.06e,f | 4.36±0.05e,f | 4.33±0.04f |
| T6 | 4.98±0.04a | 4.96±0.05a,b | 4.9±0.06a–d | 4.83±0.05d |
| T7 | 4.99±0.04a | 4.95±0.03a–c | 4.92±0.03a–d | 4.85±0.03b–d |
| T8 | 4.98±0.01a | 4.95±0.04a–c | 4.91±0.04a–d | 4.84±0.04c,d |
Mean values are the result of three replications (n = 3) and are represented as mean ± standard deviation (SD). Accordingly, identical superscript letters (a–d) in the column differ significantly from one another (P < 0.05).
Younas et al. (2024) added Lactobacillus acidophilus to buffalo milk yogurt. After 21 days of refrigeration, its protein content decreased slightly. This was due to probiotic cultures’ metabolic process, which caused protein hydrolysis. Buffalo milk is suitable for making protein-rich probiotic yogurts because despite this decrease, the protein content remained high. Younas et al. (2022) also examined the impact of different probiotic strains, such as Lactobacillus acidophilus, Lactobacillus plantarum, Lactobacillus casei, and Bifidobacterium animalis subsp. lactis, on goat milk yogurt. After 28 days of refrigeration, the researchers found that probiotics affected the texture, and organoleptic and biological activities of yogurt. The result of the study showed that adding specific probiotic strains to goat milk yogurt could affect its physicochemical characteristics, such as protein content, over time. Proteolysis increased in all samples during storage, which showed the proteolytic activity of LAB.
Fat
Table 4 shows how the fat content of yogurt samples is affected by different probiotic cultures and storage periods. All treatments showed different fat proportions at the beginning (day 0), although the initial fat content of the buffalo milk-based yogurts (T5 through T8) was greater (4.46–4.69%) than those of the cow milk-based yogurts (T1 through T4) (3.91–4.13%). Throughout the 21-day storage, all treatments showed a small decrease in fat content. The decrease was more noticeable in cow milk-based yogurts, while buffalo milk-based yogurts kept their fat content comparatively higher over the course of storage.
Table 4. Effect of probiotic cultures and days on fat content (%).
| Treatments | Storage days | |||
|---|---|---|---|---|
| 0 | 7 | 14 | 21 | |
| T1 | 3.91±0.02h,i | 3.87±0.04i,j | 3.83±0.03i,j | 3.79±0.02j |
| T2 | 4.13±0.03f | 4.11±0.04f | 4.06±0.05f,g | 3.99±0.03g,h |
| T3 | 4.13±0.02f | 4.11±0.02f | 4.08±0.03f,g | 4.01±0.03g |
| T4 | 4.13±0.01f | 4.11±0.03f | 4.07±0.04f,g | 4±0.03g |
| T5 | 4.46±0.01c,d | 4.42±0.05d,e | 4.37±0.04d,e | 4.34±0.03e |
| T6 | 4.69±0.03a | 4.67±0.04a | 4.61±0.05a,b | 4.54±0.05b,c |
| T7 | 4.69±0.05a | 4.66±0.02a | 4.63±0.02a,b | 4.56±0.02b |
| T8 | 4.69±0.01a | 4.67±0.03a | 4.62±0.03a,b | 4.55±0.03b |
Mean values are the result of three replications (n = 3) and are represented as mean ± standard deviation (SD). Accordingly, the identical superscript letters (a–d) in the column differ significantly from one another (P < 0.05).
Results of Younas et al.’s (2024) study on addition of Lactobacillus acidophilus to buffalo milk yogurt was in line with this. The study found that after 21 days of refrigeration, the fat content of buffalo milk yogurt decreased slightly. This was due to the probiotic culture metabolic process which caused lipid hydrolysis. Buffalo milk is suitable for making rich probiotic yogurts as evidenced by the relatively high fat content that remained after this reduction. The same result was demonstrated by Tavakoli et al. (2019), who studied how the physicochemical characteristics of probiotic yogurt during storage were affected by the fat content of milk and starter culture. According to the study, regardless of the starter culture used, yogurt samples with higher initial fat content decreased slightly in fat percentage. This finding implied that although probiotic activity might be involved in slight lipid deterioration, fat content at the beginning had a major impact on the total stability of fat throughout the storage.
pH is used in the culinary industry to determine the quality of food. Statistical findings showed that probiotic cultures and storage significantly impacted the pH of yogurt (Table 5). The highest pH was observed in T2 (4.56±0.03), and the lowest was in T5 (4.17±0.02) on day 0. During storage duration, the treatments showed minor alterations in pH content. During storage, the pH of probiotic yogurt reduced from 4.56±0.03 to to 4.06±0.06. Notably, decrease in pH was more pronounced in buffalo milk-based yogurts whereas cow milk-based yogurts maintained relatively higher pH levels throughout the storage.
Table 5. Effect of probiotic cultures and days on pH.
| Treatments | Storage days | |||
|---|---|---|---|---|
| 0 | 7 | 14 | 21 | |
| T1 | 4.51±0.01a–d | 4.47±0.03a–d | 4.43±0.03b–d | 4.39±0.03d,e |
| T2 | 4.56±0.03a | 4.51±0.07a–d | 4.47±0.06a–d | 4.4±0.04d |
| T3 | 4.54±0.03a–c | 4.52±0.03a–d | 4.48±0.03a–d | 4.41±0.03c,d |
| T4 | 4.55±0.01a,b | 4.52±0.05a–d | 4.48±0.04a–d | 4.41±0.03d |
| T5 | 4.17±0.02f–j | 4.14±0.07f–j | 4.09±0.06i,j | 4.06±0.06j |
| T6 | 4.26±0.06e,f | 4.24±0.07f–h | 4.2±0.07f–i | 4.13±0.05g–j |
| T7 | 4.25±0.04f-h | 4.23±0.04f–h | 4.19±0.04f–i | 4.12±0.04h–j |
| T8 | 4.26±0.02f,g | 4.24±0.05f–h | 4.2±0.06f–i | 4.13±0.05h–j |
Mean values are the result of three replications (n = 3) and are represented as mean ± standard deviation (SD). Accordingly, identical superscript letters (a–d) in the column differ significantly from one another (P < 0.05).
After fermentation with various starting cultures, Taha et al. (2017) evaluated the antibacterial and antioxidant properties of bioactive peptides in buffalo yogurt. Titratable acidity showed an upward trend throughout the 15-day storage period; a range of 0.65±0.005–1.3±0.028 was recorded. The effects of storage conditions on the physicochemical properties of the final product were also investigated by Terpiłowski and colleagues (2023) in relation to the dry ingredients used in yogurt. Variations in temperature and storage period of dry components were shown to have an impact on the incubation time for yogurt to reach a pH of 4.6. Keeping starter cultures at 5°C for up to 8 weeks did not significantly affect the incubation period or the vitality of cultures, demonstrating that proper storage conditions are crucial for maintaining the consistency and quality of yogurt products.
A study conducted by Kim et al. (2022) evaluated the effects of several probiotic LAB on the quality and preservation qualities of Greek yogurt, which further supported these conclusions. The researchers observed that pH of each yogurt sample decreased after being stored at 4°C for 21 days. pH of Greek yogurt, including Streptococcus thermophilus, Lactobacillus bulgaricus, and Lactobacillus gasseri BNR17, were notably stable, compared to other formulations. Accordingly, the rate at which pH decreased during storage could be influenced by specific probiotic strains, thereby affecting yogurt’s flavor and shelf life.
Quantitative analysis of organic acids
Acetic acid
The effects of different probiotic cultures and storage period on the quantity of acetic acid in yogurt samples are shown in Table 6. Acetic acid range was numerous throughout all remedies at the start (day 0), with buffalo milk-based yogurts (T5–T8) frequently displaying better initial concentrations than cow milk-primarily based remedies (T1–T4). The quantity of acetic acid in every remedy increased gradually during 21-day storage. Considerably, buffalo milk- based yogurts showed a greater boom in acetic acid, especially in treatments that blanketed extra probiotic traces together with Lactobacillus acidophilus and Bifidobacterium bifidum (T6–T8). The consequences of Younas et al.’s (2024) research on the addition of Lactobacillus acidophilus to buffalo milk yogurt were steady with this study. Over 21 days of refrigeration, the authors discovered that pH decreased notably, with the biggest drop occurring in yogurt that protected 100% probiotic way of life. L. acidophilus’s metabolic strategies, which generated lactic acid and increased yogurt’s acidity, were attributed for pH decrease. These effects highlighted the effect of probiotic cultures on acidification that took place in yogurt.
Table 6. Effect of probiotic cultures and days on acetic acid (ppm).
| Treatments | Storage days | |||
|---|---|---|---|---|
| 0 | 7 | 14 | 21 | |
| T1 | 25.34±0.01s | 38.69±1.01r | 52.04±0.84n,o | 67.4±1.88i,j |
| T2 | 49.2±1.31o,p | 62.56±2.22j–l | 75.91±1.08e–g | 91.26±0.73b |
| T3 | 46.7±1.6p,q | 60.06±3.17l,m | 73.41±2.11g,h | 88.76±1.41b,c |
| T4 | 47.95±2.49o,p | 61.31±2.69k,l | 74.66±1.59f,g | 90.01±1b |
| T5 | 42.17±2.03q,r | 55.52±1.41m,n | 68.88±0.76hi | 84.23±1.53c,d |
| T6 | 67.2±0.87i,j | 80.56±2.22d,e | 93.91±1.08b | 109.26±0.73a |
| T7 | 64.7±1.6i–l | 78.06±3.17e–g | 91.41±2.11b | 106.76±1.41a |
| T8 | 65.95±2.49i–k | 79.31±2.69d–f | 92.66±1.59b | 108.01±1a |
Mean values are the result of three replications (n = 3), and are represented as mean ± standard deviation (SD). Accordingly, identical superscript letters (a–d) in the column differ significantly from one another (P < 0.05).
Similar to this, Heydari et al. (2021) investigated the biochemical traits of probiotic yogurt produced by the use of Lactobacillus casei and other local Iranian strains. Yogurts with L. casei had better levels of acetic acid than probiotic-unfastened control samples.
Lactic acid
Lactic acid’s acidity influences the rheological and sensory properties of milk, enhancing its flavor and maintaining its shelf life (Cheng, 2010). Table 7 shows how the lactic acid content of yogurt samples is affected by different probiotic cultures and storage periods. All treatments had variable amounts of lactic acid at the beginning (day 0); however, yogurts made from buffalo milk (T5–T8) typically had higher starting concentrations than those made from cow milk (T1–T4). The amount of lactic acid in each treatment increased gradually throughout the 21-day storage. Strangely, remedies that blanketed extra probiotic strains, such as Bifidobacterium bifidum and Lactobacillus acidophilus (T2–T4 and T6–T8) confirmed an extra noticeable increase in lactic acid.
Table 7. Effect of probiotic cultures and days on lactic acid (ppm).
| Treatments | Storage days | |||
|---|---|---|---|---|
| 0 | 7 | 14 | 21 | |
| T1 | 768.77±2.08r | 858.12±8.02p,q | 901.48±5.75n | 951.83±2.72lm |
| T2 | 892.64±8.46n,o | 981.99±9.35i,j | 1025.34±5.98f,g | 1075.7±1.18a,b |
| T3 | 855.47±9.51p,q | 934.82±6.1m | 978.18±8.01j,k | 1028.53±3.22e–g |
| T4 | 874.05±7.85o,p | 958.41±7.66k,l | 1001.76±6.99h,i | 1052.11±2.18c,d |
| T5 | 848.6±8.65q | 937.96±5.05l,m | 981.31±4.36i,j | 1031.66±9.64d–g |
| T6 | 910.64±17.3n | 999.99±9.35h,i | 1043.34±5.98d–f | 1093.7±1.18a |
| T7 | 873.47±9.51o,p | 952.82±6.1lm | 996.18±8.01i,j | 1046.53±3.22d,e |
| T8 | 892.05±7.85n,o | 976.41±7.66j,k | 1019.76±6.99g,h | 1070.11±2.18b,c |
Mean ± standard deviation (SD) represent mean values, which are the outcome of three replications (n = 3). This indicates that identical superscript letters (a–d) in the column differ considerably (P < 0.05) from one another.
In addition, Kim et al. (2022) assessed how diverse probiotic lactic acid microorganisms affected the yogurt which is stored at homes According to researchers’ findings, level of lactic acid in each yogurt sample increased over 21 days of storage at 4°C. Interestingly, Greek yogurt fermented with Lactobacillus bulgaricus, Streptococcus thermophilus, and Lactobacillus gasseri BNR17 confirmed exceptional increase in lactic acid concentration, which improved its physicochemical traits and sensory acceptability.
Similarly, after 12 h of fermentation, the medium with 2% probiotic, 1.5% galactooligosaccharides (GOS), and 1.5% maltodextrin had maximum acidity, with a median value of 5, 91% consistent with the findings of Quddos et al. (2018). The medium that contained 1.5% GOS, 1.5% maltodextrin, and 1% probiotic (T17) had a mean value of 5, 79% consistent. In order to be away from cardiovascular ailments and electrolytic imbalance, the protein and calorie consumption of patients is reduced considerably, but consumption of a suitable diet may additionally restrict the loss of various critical nutrients and additional use the banificial bacteria, such as lactic acid microorganisms (Lactobacillus bulgaricus and Lactobacillus acidophilus) (Hameed et al., 2024).
Citric acid
Table 8 shows the effect of probiotic cultures and storage period on citric acid content (ppm) in yogurt. Across all treatments, citric acid levels increased gradually throughout the course of 21-day storage, suggesting the ongoing metabolic activity during storage. Interestingly, treatments with more probiotic strains (such as T2, T6, and T8) showed noticeably higher levels of citric acid than the control (T1), indicating that the increased fermentation activity of these probiotic cultures increased the synthesis of organic acids. For example, treatment T6 achieved 377.81 ppm on day 21, but the control T1 only managed to reach 270.61 ppm. When many strains of probiotic cultures are utilized, the metabolic processes they stimulate (such the conversion of citrate into other metabolites) are more active, which improves yogurt’s acid profile and possibly its sensory qualities.
Table 8. Effect of probiotic cultures and days on citric acid content (ppm).
| Treatments | Storage days | |||
|---|---|---|---|---|
| 0 | 7 | 14 | 21 | |
| T1 | 175.45±3.06n | 200.5±1.01m | 235.55±0.82k,l | 270.61±2.33g,h |
| T2 | 264.65±3.91h,i | 289.7±4.67f | 324.75±5.47d | 359.81±6.57b |
| T3 | 228.48±7.84l | 253.53±2.99i,j | 288.59±3.94f | 323.64±5.22d |
| T4 | 246.56±6.64j,k | 271.62±3.83g,h | 306.67±4.69e | 341.72±5.87c |
| T5 | 222.28±7.22l | 247.33±1.41j,k | 282.39±0.92f,g | 317.44±2.19d,e |
| T6 | 282.65±3.73f,g | 307.7±4.67e | 342.75±5.47c | 377.81±6.57a |
| T7 | 246.48±7.84j,k | 271.53±2.99g,h | 306.59±3.94e | 341.64±5.22c |
| T8 | 264.56±6.64h,i | 289.62±3.83f | 324.67±4.69d | 359.72±5.87b |
Mean ± standard deviation (SD) represent mean values, which are the outcome of three replications (n = 3). This indicates that identical superscript letters (a–d) in the column differ considerably (P < 0.05) from one another.
The results of Akgun et al. (2018), who looked into the combined impact of probiotic cultures and final incubation pH on the quality of buffalo milk yogurt during cold storage, were consistent with these results. According to the study, generation of organic acids, particularly citric acid, during storage was greatly impacted by the type of starter culture. In particular, citric acid concentrations of yogurts fermented with probiotic cultures were higher than those of yogurts fermented with conventional starter cultures. This suggested that the metabolic activities of the probiotics helped in the gradual increase in citric acid generation.
Evaluation of proteolysis
Water-soluble nitrogen
All yogurt samples were analyzed for their WSN content at different storage periods. The results are provided in Table 9, which shows an analysis of variance for the WSN content of different yogurt treatments kept at different storage periods. We observed significant results between storage days and various yogurt treatments, but nonsignificant results were observed between their interactions.
Table 9. Effect of treatments and days on WSN content.
| Treatments | Storage days | Total | |||
|---|---|---|---|---|---|
| 0 | 7 | 14 | 21 | ||
| T1 | 0.11±0t | 0.12±0r–t | 0.13±0n–r | 0.14±0i–o | 0.13±0f |
| T2 | 0.13±0q–s | 0.14±0m–q | 0.15±0g–m | 0.16±0d–g | 0.14±0c,d |
| T3 | 0.12±0s,t | 0.13±0p–s | 0.14±0k–p | 0.15±0f–k | 0.14±0e |
| T4 | 0.13±0r–t | 0.13±0n–r | 0.14±0i–n | 0.15±0e–i | 0.14±0d,e |
| T5 | 0.13±0o–s | 0.14±0j–o | 0.15±0e–j | 0.16±0b–e | 0.15±0c |
| T6 | 0.15±0h–m | 0.16±0d–h | 0.17±0a–d | 0.18±0a | 0.16±0a |
| T7 | 0.14±0lm–p | 0.15±0f–l | 0.16±0c–f | 0.17±0a–c | 0.15±0b |
| T8 | 0.14±0j–o | 0.15±0e–j | 0.16±0b–e | 0.17±0a,b | 0.16±0a,b |
| Total | 0.13±0d | 0.14±0c | 0.15±0b | 0.16±0a | |
Values not sharing superscript letters in a column or row are significant statistically.
Table 9 displays the impact of days and treatments on the WSN content of various yogurt treatments. It is evident that treatment T6 had the highest overall WSN content (0.16±0A) among the treatments, and that 21 days of storage had the highest overall WSN content (0.16±0). Treatment T6 had the highest WSN level during interaction on day 21 of storage (0.18±0), while Treatment T1 had the lowest WSN level on day 0 of storage (0.11±0).
Similarly, Niamah (2017) examined the effect of incorporating Saccharomyces boulardii to yogurt and determined that WSN increased over 21-day storage. The elevated level of WSN was related to S. boulardii’s proteolytic interest, which simplified the breakdown of milk proteins into smaller peptides and amino acids, enhancing the yogurt’s nutritional value and taste. Owing to the breakdown of casein into low-molecular weight water-soluble amino acids and peptides via non-starter lactic acid, milk, and LAB, WSN—also referred to as total nitrogen—is a distinguished proteolysis product. Owing to the continuous breakdown of casein into smaller peptides and amino acid fractions and large peptides by using starter and non-starter lactic acid microorganism (NSLAB), sure enzymes, and remaining rennet, the range of nitrogen increased with maturing period (Adouard et al., 2016).
Free amino acids
Table 10 illustrates the impact of various treatments (T1–T8) and storage periods (0, 7, 14, and 21 days) on the FAA content of a product. As storage time increased and other applications were implemented, the quantity of FAA inside the mixture increased. As storage days increased, the FAA content material also increased throughout all treatments. The FAA content material in treatment 1 (T1), for instance, increased from 31.77 mg/100 g on day 0 to 41.17 mg/100 g on day 21. This showed that proteins spoiled down into FAA throughout storage because of ongoing proteolytic pursuit. Through day 21, the overall FAA content, when averaged over all treatments, increased to 47.15 mg/100 g on day 0. The idea that storage time had a vital role in the development of loose amino acids—probably because of nonstop enzymatic hobby—was supported through this standard growth.
Table 10. Effect of treatments and days on FAA content.
| Treatments | Storage days | Total | |||
|---|---|---|---|---|---|
| 0 | 7 | 14 | 21 | ||
| T1 | 31.77±0p | 34.9±1o,p | 38.04±1.02m–o | 41.17±1.04l–n | 36.47±1.14g |
| T2 | 42.77±1.07l,m | 45.9±2.08k,l | 49.04±2.08j,k | 52.17±2.08h–j | 47.47±1.38d |
| T3 | 36.94±2.08n–p | 40.04±2.24m–o | 43.18±2.26l,m | 46.31±2.26k,l | 41.62±1.43f |
| T4 | 39.85±2.26m–o | 42.97±2.16l,m | 46.11±2.17k,l | 49.24±2.17i–k | 44.54±1.4e |
| T5 | 52.27±2.17h–j | 55.4±1.8f–h | 58.54±1.83d–g | 61.67±1.86b–e | 56.97±1.32c |
| T6 | 60.77±1.89c–f | 63.9±2.08b–d | 67.04±2.08a,b | 70.17±2.08a | 65.47±1.38a |
| T7 | 54.94±2.08g–i | 58.04±2.24e–g | 61.18±2.26c–e | 64.31±2.26b,c | 59.62±1.43c |
| T8 | 57.85±2.26e–h | 60.97±2.16c–f | 64.11±2.17b–d | 67.24±2.17a,b | 62.54±1.4b |
| Total | 47.15±2.17d | 50.27±2.17c | 53.4±2.17b | 56.54±2.17a | |
Values not sharing a superscript letter in a column or row are significant statistically.
Similar styles have been referred to in research on plant-based totally beverages, where higher quantities of FAA were determined after storage, suggesting proteolysis. Likewise, Akan (2022) tested the impact of yogurt microorganisms and fermentation period on FAA content of probiotic goat yogurt. The authors observed that, depending on particular probiotic strains applied, The starter culture’s proteolytic pursuit, which hydrolyzes milk proteins into peptides and FAA, improves yogurt’s dietary value and sensory attraction.
Evaluation of bioactivities
Antihypertensive activity
At various stored periods, the antihypertensive property of every yogurt pattern was examined. Table 11 shows how distinctly bacterial remedies and storage periods affect yogurt samples’ antihypertensive effectiveness, which is expressed as percentage suppression of ACE. With values of 22.45–46.14%, all therapies confirmed the baseline antihypertensive action at the beginning (day 0). Antihypertensive activity gradually improved for all treatments in the course of 21-day storage. Interestingly, treatments with additional probiotic strains, such as Lactobacillus acidophilus and Bifidobacterium bifidum (T2, T4, T6, and T8), showed more antihypertensive action than the control (T1). On day 21, for example, T6 had 62.48% antihypertensive effect, and T1 had 38.78% effect. The outcomes of Kong et al.’s (2021) research about the effect of probiotic yogurt on blood strains in mice with spontaneous hypertension are constant with this discovery. The authors found that consuming probiotic yogurt dramatically decreased coronary heart fee and blood stress. This changed through reworking of intestinal microbiota and the improved synthesis of quick-chain fatty acids having antihypertensive properties. Altering intestinal microbiota and producing bioactive compounds highlight the potential of probiotic-fermented dairy products in the treatment of high blood pressure. Similarly, Juandini et al. (2024) investigated theantihypertensive outcomes of Greek yogurt combined with roselle extract and probiotics. Probiotic Greek yogurt’s antihypertensive effect increased from 35.68% in the control probiotic yogurt to 81.36% in the supplemented version, consistent with the study. This was due to the mixed action of probiotics and the bioactive substances in roselle extract that increased ACE-inhibitory pursuit.
Table 11. Effect of treatments and days on antihypertensive activity.
| Treatments | Storage days | Total | |||
|---|---|---|---|---|---|
| 0 | 7 | 14 | 21 | ||
| T1 | 22.45±0.99w | 28.12±0.45v | 33.45±0.73t | 38.78±1.24q,r | 30.7±6.39h |
| T2 | 37.78±1.56q–s | 43.45±0.99m–o | 48.78±0.99h,i | 54.12±1.28e,f | 46.03±6.43d |
| T3 | 33.73±1.52t | 39.4±0.97p,q | 44.73±1.05k–m | 50.06±1.39g,h | 41.98±6.44f |
| T4 | 35.76±1.54s,t | 41.42±0.98o,p | 46.76±1.02i–k | 52.09±1.34f,g | 44.01±6.43e |
| T5 | 30.81±1.53u | 36.48±1.19r,s | 41.81±1.58n–p | 47.14±2.06i–k | 39.06±6.49g |
| T6 | 46.14±1.99j–l | 51.81±1.53f,g | 57.14±1.76c,d | 62.48±2.13a | 54.39±6.54a |
| T7 | 42.09±2.02n,o | 47.76±1.59h–j | 53.09±1.85e,f | 58.42±2.24b,c | 50.34±6.56c |
| T8 | 44.12±2l–n | 49.78±1.56g,h | 55.12±1.81d,e | 60.45±2.18a,b | 52.37±6.55b |
| Total | 36.61±7.55d | 42.28±7.49c | 47.61±7.51b | 52.94±7.57a | |
Values not sharing superscript letter in a column or row are significant statistically.
Antioxidant activity
All the samples of yogurt were analyzed for their antioxidant activity at different intervals of storage. The results of analyses are shown in Table 12.
Table 12. Effect of treatments and days on antioxidant activity.
| Treatments | Storage days | Total | |||
|---|---|---|---|---|---|
| 0 | 7 | 14 | 21 | ||
| T1 | 31.73±1.53x | 33.73±1.49w | 35.55±1.66v | 37.4±1.88u | 34.6±2.61h |
| T2 | 42.37±0.79s | 44.37±0.73p,q | 46.2±0.9o | 48.05±1.11n | 45.25±2.33e |
| T3 | 38.49±1.01u | 40.49±1.01t | 42.32±1.2s | 44.17±1.42q,r | 41.37±2.42g |
| T4 | 40.43±0.87t | 42.43±0.85r,s | 44.26±1.03q | 46.11±1.25o,p | 43.31±2.37f |
| T5 | 48±0.89n | 50±0.84m | 51.82±1.01k,l | 53.67±1.22i,j | 50.87±2.36d |
| T6 | 60.54±0.77d,e | 62.54±0.7c | 64.36±0.84b | 66.21±1.05a | 63.41±2.32a |
| T7 | 51.23±0.98l,m | 53.19±0.9j,k | 55.02±1.09h,i | 56.87±1.3f,g | 54.08±2.37c |
| T8 | 55.89±0.86g,h | 57.87±0.78f | 59.69±0.95e | 61.54±1.16c,d | 58.75±2.34b |
| Total | 46.08±9.21d | 48.08±9.2c | 49.9±9.21b | 51.75±9.23a | |
Values not sharing superscripted letter in a column or row are significant statistically.
Table 12 shows the analysis of variance for antioxidant activity of different treatments of yogurt stored at different storage intervals. We observed that highly significant results were obtained between storage days and various treatments of yogurt; however, nonsignificant results were observed for their interaction. It was observed that the highest overall antioxidant activity in the case of treatments was found for treatment T6 (63.41±2.32), while the highest overall antioxidant activity during storage was found on day 21 of storage (51.75±9.23). For interaction, the highest antioxidant activity was observed for treatment T6 (66.21±1.05) on day 21 of storage, while the lowest antioxidant activity was found for treatment T1 on day 0 of storage (31.73±1.53). However, in the fourth sample of yogurt, significant antioxidant values were recorded when yoghurt and probiotic bacteria were used in conjunction after day 0 assessment. We found results of the present study in compliance with results of the research conducted by Gupta and Garg (2009).
This trend aligned with the findings of Akan et al. (2022), who investigated the combined effect of probiotic cultures and incubation final pH on the quality of buffalo milk yogurt during cold storage. The study reported that the type of starter culture significantly influenced the production of organic acids, including citric acid, during storage. Specifically, yogurts fermented with probiotic cultures exhibited higher citric acid concentrations compared to those with traditional starter cultures, suggesting that the metabolic activities of added probiotics contribute to increased production of citric acid over time.
Nishat et al. (2024) revealed the antioxidant potential of muskmelon seed oil that there is a significant interaction between all the treatments. The interaction effect of days and treatments is also significant.
Descriptive sensory analysis of yogurt
Significant variations in descriptive sensory attributes were noted while investigating the impact of probiotic culture on yogurt. Statistical findings showed that probiotic cultures and storage significantly impacted the color of yogurt (Table 13). The highest color was observed in T6 (4.76±0.13) and the lowest was in T1 (3.97±0.15) on day 0. All treatments exhibited slight changes in colors over the course of storage. Over time, probiotic yogurt’s hue increased from 3.97±0.15 to 4.94±0.17.
Table 13. Effect of probiotic cultures and days on sensory color.
| Treatments | Storage days | |||
|---|---|---|---|---|
| 0 | 7 | 14 | 21 | |
| T1 | 3.97±0.15r | 4.03±0.12q | 4.06±0.26q | 4.13±0.29p |
| T2 | 4.18±0.14o | 4.24±0.02m,n | 4.3±0.06k,l | 4.38±0.13j |
| T3 | 4.21±0.1n,o | 4.26±0.17l,m | 4.31±0.21k | 4.35±0.12j |
| T4 | 4.2±0.27o | 4.25±0.22m,n | 4.31±0.18k | 4.37±0.12j |
| T5 | 4.51±0.23i | 4.56±0.08h | 4.62±0.04g | 4.69±0.33f |
| T6 | 4.76±0.13d | 4.81±0.32c | 4.87±0.24b | 4.91±0.17a |
| T7 | 4.72±0.35e,f | 4.8±0.18c | 4.86±0.09b | 4.94±0.17a |
| T8 | 4.75±0.28d,e | 4.8±0.26c | 4.86±0.02b | 4.92±0.31a |
Mean ± standard deviation (SD) represent mean values, which are the outcome of three replications (n = 3). This indicates that identical superscripted letters (a–d) in the column differ considerably (P < 0.05) from one another.
The rheological traits and sensory profile of yogurt were made by using a unique aggregate of probiotic cultures comprising Lactobacillus plantarum HA119 and Bifidobacterium animalis subsp. lactis B94 (Ilić et al., 2024), and their findings were found to be steady with the present commentary. In the study, adding probiotic cultures produced yogurt with decreased fats content, similar to the sensory features of excessive-fat yogurts, inclusive of enhanced color capabilities. Probiotic culture’s metabolic functions were attributed to producing improved sensory color, which could additionally have an effect on pigment balance. Similarly, Kim et al. (2022) investigated how probiotic LAB affected Greek yogurt’s exceptional and storage acts, including the bacteria, such Lactobacillus gasseri BNR17 and Lactobacillus plantarum HY7714, which improved yogurt’s physicochemical characteristics and sensory characteristics along with coloration. Probiotic microorganism’s synthesis of exopolysaccharides (EPS) could modify yogurt’s texture and appearance.
Appearance
Table 14 shows how probiotic microorganisms and storage time affect the appearance of yogurt samples. Across all treatments, the results showed a general increase in appearance scores throughout 21-day storage, indicating that probiotic cultures gradually improved yogurt’s visual appeal. Treatments containing particular probiotic strains, such as T6–T8, demonstrated noticeably superior appearance ratings during storage period, whereas the control sample (T1) had the lowest score. T6 had the highest score on day 21 (4.54), suggesting that this formulation produced yogurt with maximum visual appeal.
Table 14. Effect of probiotic cultures and days on appearance.
| Treatments | Storage days | |||
|---|---|---|---|---|
| 0 | 7 | 14 | 21 | |
| T1 | 3.51±0.07q | 3.63±0.13p | 3.59±0.21p,q | 3.73±0.4o |
| T2 | 3.78±0.31m–o | 3.77±0.07n,o | 3.9±0.29i–k | 3.98±0.16i |
| T3 | 3.78±0.2n,o | 3.83±0.06k–n | 3.85±0.14j–n | 3.89±0.37i–l |
| T4 | 3.8±0.31l–o | 3.78±0.08m–o | 3.87±0.33j–m | 3.93±0.12i,j |
| T5 | 4.11±0.17h | 4.1±0.26h | 4.15±0.15g,h | 4.23±0.02f,g |
| T6 | 4.32±0.18c–f | 4.37±0.1b–e | 4.42±0.27b | 4.54±0.21a |
| T7 | 4.29±0.11d–f | 4.38±0.11b–d | 4.43±0.39b | 4.44±0.29b |
| T8 | 4.28±0.23e,f | 4.37±0.13b–d | 4.39±0.37b,c | 4.45±0.14a,b |
Mean values are the result of three replications (n = 3) and are shown as mean ± standard deviation (SD). Values with the same superscript letters (a–d) in the column are significantly (P < 0.05) different from one another.
Probiotic bacteria, according to previous studies, can improve the physical and sensory qualities of yogurt, especially its appearance. Adding Lactobacillus casei and Bifidobacterium animalis to yogurt recipes enhanced their overall sensory appeal, especially in terms of texture, consistency, and appearance (Jaman et al., 2022). EPS-producing probiotic strains would contribute to a more consistent and glossy appearance, which would account for higher scores in probiotic culture treatments. Smooth, natural, and vibrant hues are essential qualities for yoghurt. Yogurt that is white to off-white on color may be flavorless. The surface should exhibit a uniform appearance, devoid of any signs of whey growth, separation, or discoloration. It is critical to ensure consistency in color, size, and distribution of ingredients.
Consistency of yogurt
Table 15 illustrates the effect of various probiotic cultures and storage periods on the consistency of yogurt samples as evaluated by sensory panels. Consistency scores increased progressively over 21-day storage across all treatments, indicating an improvement in the perceived texture of yogurt over time. Remarkably, treatments with greater probiotic bacteria, such as Lactobacillus acidophilus and Bifidobacterium animalis subsp. lactis (T2, T4, T6, and T8), confirmed better consistency than the control (T1). On day 21, treatment T6 had a consistency of 4.27, while treatment T1 had a consistency of 3.47. This indicated that the addition of specific probiotic culture improved the consistency of yogurt.
Table 15. Effect of probiotic cultures and days on consistency.
| Treatments | Storage days | |||
|---|---|---|---|---|
| 0 | 7 | 14 | 21 | |
| T1 | 3.24±0.13j | 3.36±0.23i,j | 3.33±0.25i,j | 3.47±0.09h–j |
| T2 | 3.52±0.13g–j | 3.51±0.25h–j | 3.63±0.28d–j | 3.71±0.13b–i |
| T3 | 3.51±0.26g–j | 3.56±0.31i,j | 3.58±0.04e–j | 3.62±0.16d–j |
| T4 | 3.53±0.03g–j | 3.52±0.29g–j | 3.61±0.33d–j | 3.67±0.16c–j |
| T5 | 3.84±0.13a–h | 3.83±0.14a–h | 3.89±0.12a–h | 3.96±0.09a–g |
| T6 | 4.05±0.3a–d | 4.1±0.28a–c | 4.16±0.1a,b | 4.27±0.33a |
| T7 | 4.03±0.05a–e | 4.11±0.05a–c | 4.17±0.19a | 4.17±0.07a |
| T8 | 4.01±0.07a–f | 4.1±0.31a–c | 4.13±0.24a,b | 4.19±0.33a |
Mean ± standard deviation (S.D.) represent mean values, which are the outcome of three replications (n = 3). This indicates that identical superscripted letters (a–d) in the column differ considerably (P < 0.05) from one another.
Similarly, Fan et al. (2022) checked how adding Lacticaseibacillus casei and Levilactobacillus brevis affected yogurt’s textural traits. The authors confirmed that in comparison to manipulated samples, yogurt containing both probiotic lines had better hardness and adhesiveness in addition to decreased syneresis. Probiotics’ metabolic activities, which boosted yogurt’s mouthfeel and structural integrity, were associated with their improved textural qualities. These findings were consistent with those of Turgut and Çakmakçi (2018), who found that yogurt consistency varied appreciably. During storage, no discernible alternative to consistency was discovered in any of the seven formulations.
It was determined that for all seven yogurt formulations, maximum sensory qualities did not adjust through 10-day chilling period. Yogurt’s texture and body must be firm, like a custard, free of lumps. A spoonful of yogurt should retain its shape with no jagged edges. It must be made sure that bulk flavoring components are dispersed equally throughout the finished product.
Sourness
The yogurt should possess a pleasant, refreshing, and sour acidic taste. Undesirable flavors, such as bitterness, rancidity, oxidation, staleness, sourness, and dirtiness, must be eliminated. Statistical findings showed that probiotic cultures and storage significantly impacted sourness of yogurt (Table 16). The highest sourness was noted in T6 (4.58±0.04) and the lowest was in T1 (3.77±0.08) on day 0. During storage, the treatments showed minor alterations in sourness, which increased slightly from 3.77±0.08 to 4.80±0.03. These results were consistent with those of Soni et al. (2020), who revealed substantial variation in the sourness of yogurt. The used probiotic strain greatly impacted the flavor, texture, aroma, sourness, and sweetness of yogurt.
Table 16. Effect of probiotic cultures and days on sourness.
| Treatments | Storage days | |||
|---|---|---|---|---|
| 0 | 7 | 14 | 21 | |
| T1 | 3.77±0.08j | 3.9±0.06i,j | 3.86±0.37i,j | 4±0.04h–j |
| T2 | 4.05±0.32g–j | 4.04±0.17g–j | 4.16±0.11e–i | 4.24±0.26c–i |
| T3 | 4.04±0.11g–j | 4.09±0.26g–j | 4.11±0.24f–j | 4.15±0.05f–j |
| T4 | 4.07±0.17g–j | 4.05±0.28g–j | 4.14±0.06f–j | 4.2±0.06d–i |
| T5 | 4.37±0.34b–h | 4.36±0.32b–h | 4.42±0.09a–g | 4.49±0.13a–f |
| T6 | 4.58±0.04a–c | 4.63±0.05a,b | 4.69±0.2a,b | 4.8±0.03a |
| T7 | 4.56±0.09a–d | 4.65±0.35a,b | 4.7±0.37a,b | 4.71±0.36a,b |
| T8 | 4.55±0.17a–e | 4.64±0.39a,b | 4.66±0.28a,b | 4.72±0.04a,b |
Mean ± standard deviation (S.D.) represents mean values, which are the outcome of three replications (n = 3). This indicates that identical superscripted letters (a–d) in the column differ considerably (P < 0.05) from one another.
Soni et al. (2020) reported no significant change in total soluble solids (TSS), total viable counts, flavor, aroma, appearance, and mouthfeel in all seven formulations during storage (P < 0.05). However, in yogurt with Lactobacillus acidophilus and Bifidobacterium bifidum animalis, water-holding capacity, sourness, and sweetness changed significantly (P < 0.05).
Odor intensity
Statistical findings indicated that probiotic cultures and storage nonsignificant impacted the odor intensity of yogurt (Table 17). The highest odor intensity was noted in T6 (4.68±0.26) and the lowest was in T1 (3.87±0.17) on day 0. During storage, the treatments showed minor alterations in odor intensity, which nonsignificant changed from 3.87±0.17 to 4.78±0.37.
Table 17. Effect of probiotic cultures and days on odor intensity.
| Treatments | Storage days | |||
|---|---|---|---|---|
| 0 | 7 | 14 | 21 | |
| T1 | 3.87±0.17n | 4±0.38l–n | 3.96±0.12m,n | 4.1±0.16k–n |
| T2 | 4.15±0.39h–n | 4.14±0.25j–n | 4.26±0.35c–n | 4.34±0.2a–n |
| T3 | 4.14±0.05i–n | 4.19±0.33f–n | 4.21±0.11e–n | 4.25±0.16d–n |
| T4 | 4.17±0.08g–n | 4.15±0.29h–n | 4.24±0.13d–n | 4.3±0.21b–n |
| T5 | 4.47±0.16a–l | 4.46±0.31a–m | 4.52±0.07a–k | 4.59±0.11a–k |
| T6 | 4.68±0.26a–f | 4.64±0.02a–j | 4.71±0.15a–e | 4.78±0.37a,b |
| T7 | 4.66±0.23a–g | 4.65±0.21a–h | 4.72±0.23a–e | 4.81±0.22a |
| T8 | 4.57±0.38a–k | 4.65±0.05a–i | 4.76±0.39a–c | 4.72±0.22a–d |
Mean values are the result of three replications (n = 3) and are represented as mean ± standard deviation (SD). Identical superscript letters (a–d) in the column differ significantly from one another (P < 0.05).
The findings of Ilić et al. (2024), who examined the rheological characteristics and sensory profile of yogurt and made a unique combination of probiotic cultures, were consistent with this observation. According to the study, yogurts with a more noticeable consistency—which is a result of probiotic bacteria’s metabolic activity—had an overall milder odor. Accordingly, probiotic cultures may improve some textural qualities, but their effect on the strength of odor may differ according on the strains utilized and their metabolic byproducts.
Likewise, a study done by Akan (2022) looked at how probiotic viability, antioxidant activity, and free amino acid content were affected by fermentation duration and yogurt bacteria in probiotic goat yogurts. The addition of yogurt culture was shown to boost lactic acid concentrations and show a shorter fermentation period, which impacted the final product’s sensory qualities, particularly the strength of its odor. According to the study, the sensory qualities of yogurt are greatly influenced by the probiotic strains used and the conditions in which they fermented.
Taste
Statistical findings indicated that probiotic cultures and storage significantly impacted the taste of yogurt (Table 18). Maximum taste was noticed in T7 (4.76±0.39) and minimum taste was in T1 (3.97±0.08) on day 0. During storage, the treatments showed minor alterations in taste, which changed significantly from 3.87±0.17 to 4.81±0.19. These results were consistent with those of Yilmaz-Ersan and Topcuoglu (2022), who revealed significant variation in the taste of yogurt during storage. Based on panelists’ descriptions, substituting almond milk resulted in nutty flavor, sweetness, and a slightly bitter taste.
Table 18. Effect of probiotic cultures and days on taste.
| Treatments | Storage days | |||
|---|---|---|---|---|
| 0 | 7 | 14 | 21 | |
| T1 | 3.97±0.08f | 4.1±0.21d–f | 4.06±0.03e,f | 4.2±0.16c–f |
| T2 | 4.25±0.19b–f | 4.27±0.09b–f | 4.36±0.37a–f | 4.44±0.29a–f |
| T3 | 4.24±0.18b–f | 4.29±0.32a–f | 4.31±0.17a–f | 4.39±0.3a–f |
| T4 | 4.27±0.11b–f | 4.25±0.23b–f | 4.34±0.08a–f | 4.4±0.09a–f |
| T5 | 4.51±0.04a–f | 4.56±0.38a–e | 4.62±0.35a–d | 4.66±0.07a–c |
| T6 | 4.65±0.08a-c | 4.77±0.23ab | 4.81±0.19a | 4.76±0.25ab |
| T7 | 4.76±0.39a,b | 4.64±0.36a–c | 4.82±0.24a | 4.71±0.11a–c |
| T8 | 4.67±0.28a–c | 4.75±0.24a,b | 4.68±0.32a–c | 4.72±0.07a–c |
Mean ± standard deviation (SD) represents mean values, which are the outcome of three replications (n = 3). This indicates that identical superscript letters (a–d) in the column differ considerably (P < 0.05) from one another.
General acceptability
The data in Table 19 illustrate the effect of various probiotic cultures and storage periods on the general acceptability of yogurt samples. General acceptability scores increased slightly over 21-day storage across all treatments, suggesting that the perceived overall quality of the yogurt was maintained or marginally enhanced with time. Notably, treatments incorporating additional probiotic strains, such as Bifidobacterium bifidum and Lactobacillus acidophilus (T2, T4, T6, and T8), demonstrated higher acceptability scores compared to the control (T1). For instance, on day 21, treatment T6 reached an acceptability rating of 4.58 whereas the control T1 exhibited a rating of 3.83. This implies that the overall sensory appeal of yogurt for the duration of storage is undoubtedly impacted by the addition of unique probiotic cultures.
Table 19. Effect of probiotic cultures and days on general acceptability.
| Treatments | Storage days | |||
|---|---|---|---|---|
| 0 | 7 | 14 | 21 | |
| T1 | 3.61±0.21o | 3.73±0.07n | 3.7±0.18n | 3.83±0.14m |
| T2 | 3.88±0.18l,m | 3.89±0.32l,m | 3.99±0.06h–j | 4.07±0.28h |
| T3 | 3.88±0.29l,m | 3.93±0.37j–l | 3.95±0.33i–l | 4±0.4h–j |
| T4 | 3.9±0.36k–m | 3.89±0.19l,m | 3.98±0.04i–k | 4.04±0.35h,i |
| T5 | 4.2±0.05g | 4.2±0.26g | 4.26±0.16f,g | 4.33±0.18e,f |
| T6 | 4.4±0.13c–e | 4.45±0.12b–d | 4.5±0.24a,b | 4.58±0.33a |
| T7 | 4.4±0.22c–e | 4.44±0.24b–d | 4.52±0.16a,b | 4.52±0.26a,b |
| T8 | 4.37±0.29d,e | 4.45±0.26b–d | 4.48±0.14b,c | 4.52±0.14a,b |
Mean ± standard deviation (SD) represents mean values, which are the outcome of three replications (n = 3). This indicates that identical superscript letters (a–d) in the column differ considerably (P < 0.05) from one another.
Lestari et al. (2022) investigated the microbiological and sensory evaluation of probiotic yogurt produced using numerous starter cultures. The authors showed that during a 4-week storage period, probiotic yogurts retained higher sensory rankings, including universal acceptability, than manipulated samples. Thus, the use of particular probiotic lines can enhance yogurt’s sensory traits and customer acceptability even as it is stored in a fridge.
Conclusion
The effects of different probiotic cultures on the sensory attributes of proteolytic peptides were evaluated during the production and preservation, proximate composition, quantitative analyses (organic acids, acetic acid, lactic acid, citric acid), proteolysis (WSN and FAA), and bioactivities of yogurt. Results indicated that probiotic cultures and storage significantly impacted the moisture content (decreased), ash content, protein content (decreased), citric acid (increased), lactic acid (increased), WSN (increased), FAA (increased), antihypertensive activities (increased), and antioxidants of yogurt during storage. In summary, the production of probiotic yogurt incorporating different probiotic cultures was accomplished effectively, and sensory assessments revealed that it possessed qualities similar to those of conventional yogurt, including appearance, flavor, texture, and the overall character. The dairy sector may find the current study useful in creating new probiotic products and in justifying the choice of probiotic strain combinations. Even though the idea of probiotics has existed since the time of the Bible, we are still in the early stages of creating consistently beneficial products for human use. The market for probiotic products is expanding quickly with growing health concerns of consumers.
Acknowledgement
The authors extend their appreciation to the Ongoing Research Funding Program (ORF-2025-641), King Saud University, Riyadh, Saudi Arabia.
Data Availability Statement
All data are available in this manuscript.
Author Contributions
Conceptualization, Data curation, Formal analysis and Methodology (Azhar Iqbal); Project administration (Mian Anjum Murtaza, Aysha Sameen); Journal format setting and uploading to journal (Muhammad Yousaf Quddoos); Resources, Funding acquisition (Amanullah Sabir, Tawfiq Alsulami); software, data curation: (Iram Hafiz), Supervision (Mian Anjum Murtaza, Aysha Sameen); Writing original draft (Azhar Iqbal); Review & editing (Mian Anjum Murtaza, Muhammad Yousaf Quddoos).
Conflict of Interest
The authors declared that they had no conflict of interest.
Ethical Approval
Because no human or animal study was involved, no ethical approval was required.
Declaration
All authors declare that this manuscript was exclusively contributed to the ‘Dairy and Food Sciences Research’.
REFERENCES
Abedin, M.M., Padhi, S., Chourasia, R., Phukon, L.C., Sarkar, P., Singh, S.P., and Rai, A.K. 2024. Lactic acid bacteria as starter cultures in food: genome characterization and comparative genomics. In: Genome Editing in Bacteria (Part 1). Bentham Science Publishers, the Netherlands, pp. 106–139. 10.2174/9789815165678124010009
Adouard, N., Magne, L., Cattenoz, T., Guillemin, H., Foligné, B., Picque, D., and Bonnarme, P. 2016. Survival of cheese-ripening microorganisms in a dynamic simulator of the gastrointestinal tract. Food Microbiology 53: 30–40. 10.1016/j.fm.2015.03.002
Akalin, A., Gönç, S., and Akbaş, Y. 2002. Variation in organic acids content during ripening of pickled white cheese. Journal of Dairy Science 85(7): 1670–1676. 10.3168/jds.S0022-0302(02)74239-2
Akan, E. 2022. The effect of fermentation time and yogurt bacteria on the physicochemical, microbiological and antioxidant properties of probiotic goat yogurts. Anais da Academia Brasileira de Ciencias 94(3): e20210875. 10.1590/0001-3765202220210875
Akgun, A., Yazici, F., and Gulec, H.A. 2018. The combined effect of probiotic cultures and incubation final pH on the quality of buffalo milk yogurt during cold storage. Food Science & Nutrition 6(2): 492–502. 10.1002/fsn3.580
Altaf, N., Quddoos, M.Y., Mahmood, S., Rehman, M.A.U., Ullah, T.S., Ainee, A., and Hussain, A. 2022. Relationship of socioeconomic status with special reference to leucorrhoea: socioeconomic status with leucorrhoea. Pakistan Journal of Health Sciences 3(7): 203–208. 10.54393/pjhs.v3i07.420
American Association of Cereal Chemists (AACC). 2000. Approved Methods of American Association of Cereal Chemists. AACC Inc., St. Paul, MN.
Amigo, L., Martinez-Maqueda, D., and Hernandez-Ledesma, B. 2020. In silico and in vitro analysis of multifunctionality of animal food-derived peptides. Foods 9(8): 991. 10.3390/foods9080991
Apostolidis, E., Kwon, Y.-I., and Shetty, K. 2007. Inhibitory potential of herb, fruit, and fungal-enriched cheese against key enzymes linked to type 2 diabetes and hypertension. Innovative Food Science & Emerging Technologies 8(1): 46–54. 10.1016/j.ifset.2006.06.001
Association of Official Analytical Chemists (AOAC). 2006. Official Methods of Analysis, 17th ed. AOAC, Arlington, TX.
Beverly, R.L., Huston, R.K., Markell, A.M., McCulley, E.A., Martin, R.L., and Dallas, D.C. 2020. Milk peptides survive in vivo gastrointestinal digestion and are excreted in the stool of infants. Journal of Nutrition 150(4): 712–721. 10.1093/jn/nxz326
Borges, T., Coelho, P., Prudêncio, C., Gomes, A., Gomes, P., and Ferraz, R. 2025. Bioactive peptides from milk proteins with antioxidant, anti-inflammatory, and antihypertensive activities. Foods 14(3): 535. 10.3390/foods14030535
Cai, Z., Guo, Y., Zheng, Q., Liu, Z., Zhong, G., Zeng, L., and Wu, Z. 2024. Screening of a potential probiotic Lactiplantibacillus plantarum NUC08 and its synergistic effects with yogurt starter. Journal of Dairy Science 107(5): 2760–2773. 10.3168/jds.2023-24113
Cai, J., Li, X., Wang, X., Jiang, C., Shen, D., Cui, X., Xie, K., Ji, C., and Cao, Y. 2021. A human β-casein-derived peptide BCCY-1 modulates the innate immune response. Food Chemistry 348(June): 129111. 10.1016/j.foodchem.2021.129111
César, A.P., Lopes, F.E., Azevedo, F.F., Pinto, Y.O., Andrade, C.R., Mesquita, F.P., and Souza, P.F. 2024. Antioxidant peptides from plants: a review. Phytochemistry Reviews 23(1): 95–104. 10.1007/s11101-023-09875-y
Cheng, H. 2010. Volatile flavor compounds in yogurt: a review. Critical Reviews in Food Science and Nutrition 50(10): 938–950. 10.1080/10408390903044081
Dan, T., Hu, H., Tian, J., He, B., Tai, J., and He, Y. 2023. Influence of different ratios of Lactobacillus delbrueckii subsp. bulgaricus and Streptococcus thermophilus on fermentation characteristics of yogurt. Molecules (Basel, Switzerland) 28(5): 2123. 10.3390/molecules28052123.
Fan, Y., Wu, Y., Li, L., and Li, Z. 2022. Influence of Lacticaseibacillus casei and Levilactobacillus brevis on the Textural and Functional Properties of Yogurt. Applied Sciences, 12(24): 12607. 10.3390/app122412607
Government of Pakistan (GOP). 2021. Economic Survey of Pakistan 2021–2022. https://www.finance.gov.pk/survey/chapters_21/02-Agriculture.pdf
Gupta, V., and Garg, R. 2009. Probiotics. Indian Journal of Medical Microbiology 27(3): 202–209. 10.4103/0255-0857.53201
Hameed, R., Quddoos, M.Y., Mahmood, S., Ullah, T.S., Ainee, A., Rafique, A., and Batool, R. 2024. Nutritional assessment concerning anthropometric, demographic, and food frequency questionnaires of hemodialysis patients in Sargodha, Pakistan. Italian Journal of Food Science 36(1): 80–91. 10.15586/ijfs.v36i1.2462
Heydari, S., Hosseini, S.E., Taheri, S., and Mortazavian, A.M. 2021. Biochemical, microbiological, and sensory properties of probiotic yogurt made from Iranian native strains compared to commercial strains. Journal of Food Processing and Preservation 45(5): e15021. 10.1111/jfpp.15021
Hong, K., Rong, Y., Jiang, Y., Yuan, J., Wu, F., Gao, L., and Wu, X. 2025. Different strategies for the biosynthesis of bioactive peptide using bioengineering technology in Pichia pastoris: a review. Food and Bioprocess Technology, 1–19.V 18, issue 1. 10.1007/s11947-025-03755-3
Ikram, A., Qasim Raza, S., Saeed, F., Afzaal, M., Munir, H., Ahmed, A., and Muhammad Anjum, F. 2021. Effect of adding Aloe vera jell on the quality and sensory properties of yogurt. Food Science & Nutrition 9(1): 480–488. 10.1002/fsn3.2017
Ilić, N., Belović, M., Memiši, N., Pestorić, M., Škrobot, D., Pezo, L., and Brouzes, J. 2024. Rheological properties and sensory profile of yoghurt produced with novel combination of probiotic cultures. Foods 13(19): 3021. 10.3390/foods13193021
Jaman, S., Islam, M.Z., Sojib, M.S.I., Hasan, M.S., Khandakar, M.M.H., Bari, M.S., Sarker, M.A.H., Habib, R., Siddiki, M.S.R., Islam, M.A., and Harun-Ur-Rashid, M. 2022. Physicochemical characteristics, sensory profile, probiotic, and starter culture viability of synbiotic yogurt. Journal of Advanced Veterinary and Animal Research 9(4): 694–701. 10.5455/javar.2022.i638
Juandini, P.A., Arief, I.I., Wulandari, Z., and Abidin, Z. 2024. Characteristics, antioxidant, and antihypertensive activities of probiotic Greek yogurt with roselle extract addition. Tropical Animal Science Journal 47(2): 235–241. 10.5398/tasj.2024.47.2.235
Kalita, Manoj Kumar, Simson Soren, Jitumoni Das, and Prerona Patowary. “Lactation.” Elements of Reproduction and Reproductive Diseases of Goats (2025): 133–148.
Keresztény, T., Libisch, B., Orbe, S.C., Nagy, T., Kerényi, Z., Kocsis, R., and Olasz, F. 2024. Isolation and characterization of lactic acid bacteria with probiotic attributes from different parts of the gastrointestinal tract of free-living wild boars in Hungary. Probiotics and Antimicrobial Proteins 16(4): 1221–1239. 10.1007/s12602-023-10113-2
Kim, J., Yun, E.J., and Kim, K.H. 2022. Effect of probiotic lactic acid bacteria (LAB) on the quality and storage characteristics of Greek yogurt. Foods 11(23): 3799. 10.3390/foods11233799
Kong, C.Y., Li, Z.M., Mao, Y.Q., Chen, H.L., Hu, W., Han, B., and Wang, L.S. 2021. Probiotic yogurt blunts the increase of blood pressure in spontaneously hypertensive rats via remodeling of the gut microbiota. Food & Function 12(20): 9773–9783. 10.1039/D1FO01836A
Kuchroo, C., and Fox, P. 1982. Soluble nitrogen in Cheddar cheese: comparison of extraction procedures. Milchwissenschaft–Milk Science International 37: 331–335.
Lestari, L.A., Nuriannisa, F., Yuliani, K., Ratnasari, D., Farida, I.N., and Azizah, E.F. 2022. Sensory and microbiological evaluation of probiotic yoghurt made with different types of probiotic cultures starter Lactobacillus acidophilus LA-5 and Bifidobacterium animalis subsp. lactis BB-12. Food Research 6(2): 64–69. 10.26656/fr.2017.6(2).188
Liu, H.X., Tu, M.L., Cheng, S.Z., Chen, H., Wang, Z.Y., and Du, M. 2019. An anticoagulant peptide from beta-casein: identification, structure and molecular mechanism. Food & Function 10(2): 886–892. 10.1039/c8fo02235f.
Minj, J., and Vij, S. 2025. Determination of synbiotic mango fruit yogurt and its bioactive peptides for biofunctional properties. Frontiers in Chemistry 12: 1470704. 10.3389/fchem.2024.1470704
Murtaza, M., Rehman, S., Anjum, F., and Huma, N. 2013. Descriptive sensory profile of cow and buffalo milk Cheddar cheese prepared using indigenous cultures. Journal of Dairy Science 96(3): 1380–1386. 10.3168/jds.2012-5992
Montgomery, D.C. 2008. Design and analysis of experiments. 7th Ed. John Wiley and Sons. Inc. Hoboken, NJ, USA.
Niamah, A.K. 2017. Physicochemical and microbial characteristics of yogurt with added Saccharomyces boulardii. Current Research in Nutrition and Food Science Journal 5(3): 300–307. 10.12944/CRNFSJ.5.3.15
Nielsen, S.D., Beverly, R.L., Underwood, M.A., and Dallas, D.C. 2020. Differences and similarities in the peptide profile of preterm and term mother’s milk, and preterm and term infant gastric samples. Nutrients 12(9): 2825. 10.3390/nu12092825
Nielsen, S.D.H., Liang, N., Rathish, H., Kim, B.J., Lueangsakulthai, J., Koh, J., and Dallas, D.C. 2024. Bioactive milk peptides: an updated comprehensive overview and database. Critical Reviews in Food Science and Nutrition 64(31): 11510–11529. 10.1080/10408398.2023.2240396
Nishat, Z., Yousaf Quddoos, M., Shahzadi, N., Ameer, K., Mohamed Ahmed, I. A., Yaqub, S., Mukhtar, S., Mahmood, S., Rafique, A., Siddique Raza, M., Shahzad, A., Umar Hayat, B., & O. Aljobair, M. 2024. Probing the physicochemical impact of musk melon seed oil on mayonnaise. Italian Journal of Food Science (Rivista Italiana di Scienza degli Alimenti) 36(2): 181–194. 10.15586/ijfs.v36i2.2527
Okamoto, K., Kawamura, S., Tagawa, M., Mizuta, T., Zahid, H.M., and Nabika, T. 2020. Production of an antihypertensive peptide from milk by the brown rot fungus Neolentinus lepideus. European Food Research and Technology 246(9): 1773–1782. 10.1007/s00217-020-03530-y
Ong, L., and Shah, N.P. 2008. Release and identification of angiotensin-converting enzyme-inhibitory peptides as influenced by ripening temperatures and probiotic adjuncts in Cheddar cheeses. LWT-Food Science and Technology 41(9): 1555–1566. 10.1016/j.lwt.2007.11.026
Pannerchelvan, Sangkaran, Leonardo Rios-Solis, Helmi Wasoh, Mohamad Zulfazli Mohd Sobri, Fadzlie Wong Faizal Wong, Mohd Shamzi Mohamed, Rosfarizan, Mohamad, and Murni Halim. 2024. Functional yogurt: a comprehensive review of its nutritional composition and health benefits. Food & Function. Page 10917 to 11306, V 15, Issue 22(2024). 10.1039/D4FO03671A
Quddos, M.Y., Farooq, U., and Husain, S. 2018. Optimizing the in vitro synbotic relationship of probiotic (acid-resistant strain of Lactobacillus acidophilus) and prebiotics (Galacto-Oligosaccharide and Maltodextrin). Int J Sci Innovs 1(2): 75–83.
Quddoos, M.Y., Mahmood, S., Yaqoob, M., Murtaza, M.A., Zahra, S.M., ud Din, G.M., Hussain, A., Rafique, A., Iftikhar, K., and Mustafa, S., 2022. The effects of natural and synthetic calcium utilization on quality parameters of cookies. Applied Food Research, 2(1), 100093. 10.1016/j.afres.2022.100093
Ranok, A., Kupradit, C., Khongla, C., Musika, S., and Suginta, W. 2021. Effect of whey protein concentrate on probiotic viability and antioxidant properties of yogurt during storage and simulated gastrointestinal transit. Journal of Food Science and Technology 58(2): 1–12. 10.1007/s13197-020-04666-9
Ren, Q., Keijzer, P., Wichers, H.J., and Hettinga, K.A. 2024. Glycation of goat milk with different casein-to-whey protein ratios and its effects on simulated infant digestion. Food Chemistry 450: 139346. 10.1016/j.foodchem.2024.139346
Robinson, R.C., Nielsen, S.D., Dallas, D.C., and Barile, D. 2021. Can cheese mites, maggots and molds enhance bioactivity? Peptidomic investigation of functional peptides in four traditional cheeses. Food & Function 12(2): 633–645. 10.1039/D0FO02439B
Rulikowska, A., Kilcawley, K.N., Doolan, I.A., Alonso-Gomez, M., Nongonierma, A.B., Hannon, J.A., and Wilkinson, M.G. 2013. The impact of reduced sodium chloride content on Cheddar cheese quality. International Dairy Journal 28(2): 45–55. 10.1016/j.idairyj.2012.08.007
Saeed, W., Mahmood, S., Mueen-ud-Din, G., and Quddoos, M.Y. 2023. Anti-dyslipidemic and anti-hypercholesteremic effects of concoction juice: a randomized, double-blind, placebo-controlled trial. Italian Journal of Food Science 35(3): 44–54. 10.15586/ijfs.v35i3.2381
Sionek, B., Szydłowska, A., Trząskowska, M., and Kołożyn-Krajewska, D. 2024. The impact of physicochemical conditions on lactic acid bacteria survival in food products. Fermentation 10(6): 298. 10.3390/fermentation10060298
Soni, R., Jain, N.K., Shah, V., Soni, J., Suthar, D., and Gohel, P. 2020. Development of probiotic yogurt: effect of strain combination on nutritional, rheological, organoleptic and probiotic properties. Journal of Food Science and Technology 57: 2038–2050. 10.1007/s13197-020-04238-3
Tahir H, Ahmed W, Siddique I, Anees-Ur-Rehman M, Tahir A, Majeed MS, Saeed U, Quddos MY, Mubashir R. 2023. Assessment of Antioxidant Activity of Stigma maydis Extract/Corn Silk Extract and Exploring its Efficacy Against Hyperglycemia in Diabetic Rats. Tropical Journal of Natural Product Research. Nov 1;7(11). 10.26538/tjnpr/v7i11.4
Tavakoli, M., Najafi, M.B.H., and Mohebbi, M. 2019. Effect of the milk fat content and starter culture selection on proteolysis and antioxidant activity of probiotic yogurt. Heliyon 5(2): e01204. 10.1016/j.heliyon.2019.e01204
Terpiłowski, K., Lange, I., Kowalczyk, K., Tomczyńska-Mleko, M., Sapiga, V., Wesołowska-Trojanowska, M., Mleko, S., and Pérez-Huertas, S. 2023. Impact of storage conditions of yogurt dry ingredients on the physicochemical properties of the final product. Applied Sciences 13(24): 13201. 10.3390/app132413201
Turgut, T., and Cakmakci, S. 2018. Probiotic strawberry yogurts: microbiological, chemical and sensory properties. Probiotics and Antimicrobial Proteins 10(1): 64–70. 10.1007/s12602-017-9278-6
Xu, B., Dong, Q., Yu, C., Chen, H., Zhao, Y., Zhang, B., and Chen, M. 2024. Advances in research on the activity evaluation, mechanism and structure-activity relationships of natural antioxidant peptides. Antioxidants 13(4): 479. 10.3390/antiox13040479
Yang, S.Y., and Yoon, K. S. 2022. Effect of probiotic lactic acid bacteria (LAB) on the quality and safety of Greek yogurt. Foods 11(23): 3799. 10.3390/foods11233799
Yilmaz-Ersan, L., and Topcuoglu, E. 2022. Evaluation of instrumental and sensory measurements using multivariate analysis in probiotic yogurt enriched with almond milk. Journal of Food Science and Technology 59(1): 133–143. 10.1007/s13197-021-04994-w
Younas, S., Murtaza, M.A., Manzoor, M.S., Arqam, U., Ali, Z., Hafiz, I., Anees Ur Rehman, M., and Imran, M. 2024. Effect of probiotic incorporation on physicochemical attributes of yogurt during storage and influence on cholesterol assimilation. Journal of Food Science 89(2): 1243–1251. 10.1111/1750-3841.16898
Zerlasht, M., Javaria, S., Quddoos, M.Y., Arshad, R., Yaqub, S., Khalid, M.Z., and Rafique, H. 2024. The impact of fenugreek, black cumin, and garlic on dough rheology, bread quality, antimicrobial activity, and microstructural analysis using a scanning electron microscope. Italian Journal of Food Science 36(4): 26. 10.15586/ijfs.v36i4.2629