
Download
E P = k 1 i η − τ ⋅ N 2 E P = k 1 i η − k 2 i τ ⋅ N 3 N = k 1 i η k 2 i τ − 1 k 2 i τ E P 4 N = 1.4368 i × 410.2297 − 1.6367 i × 8.3625 × E P i = 1 Under HK i = 0 Under MK i = − 1 Under LK 5 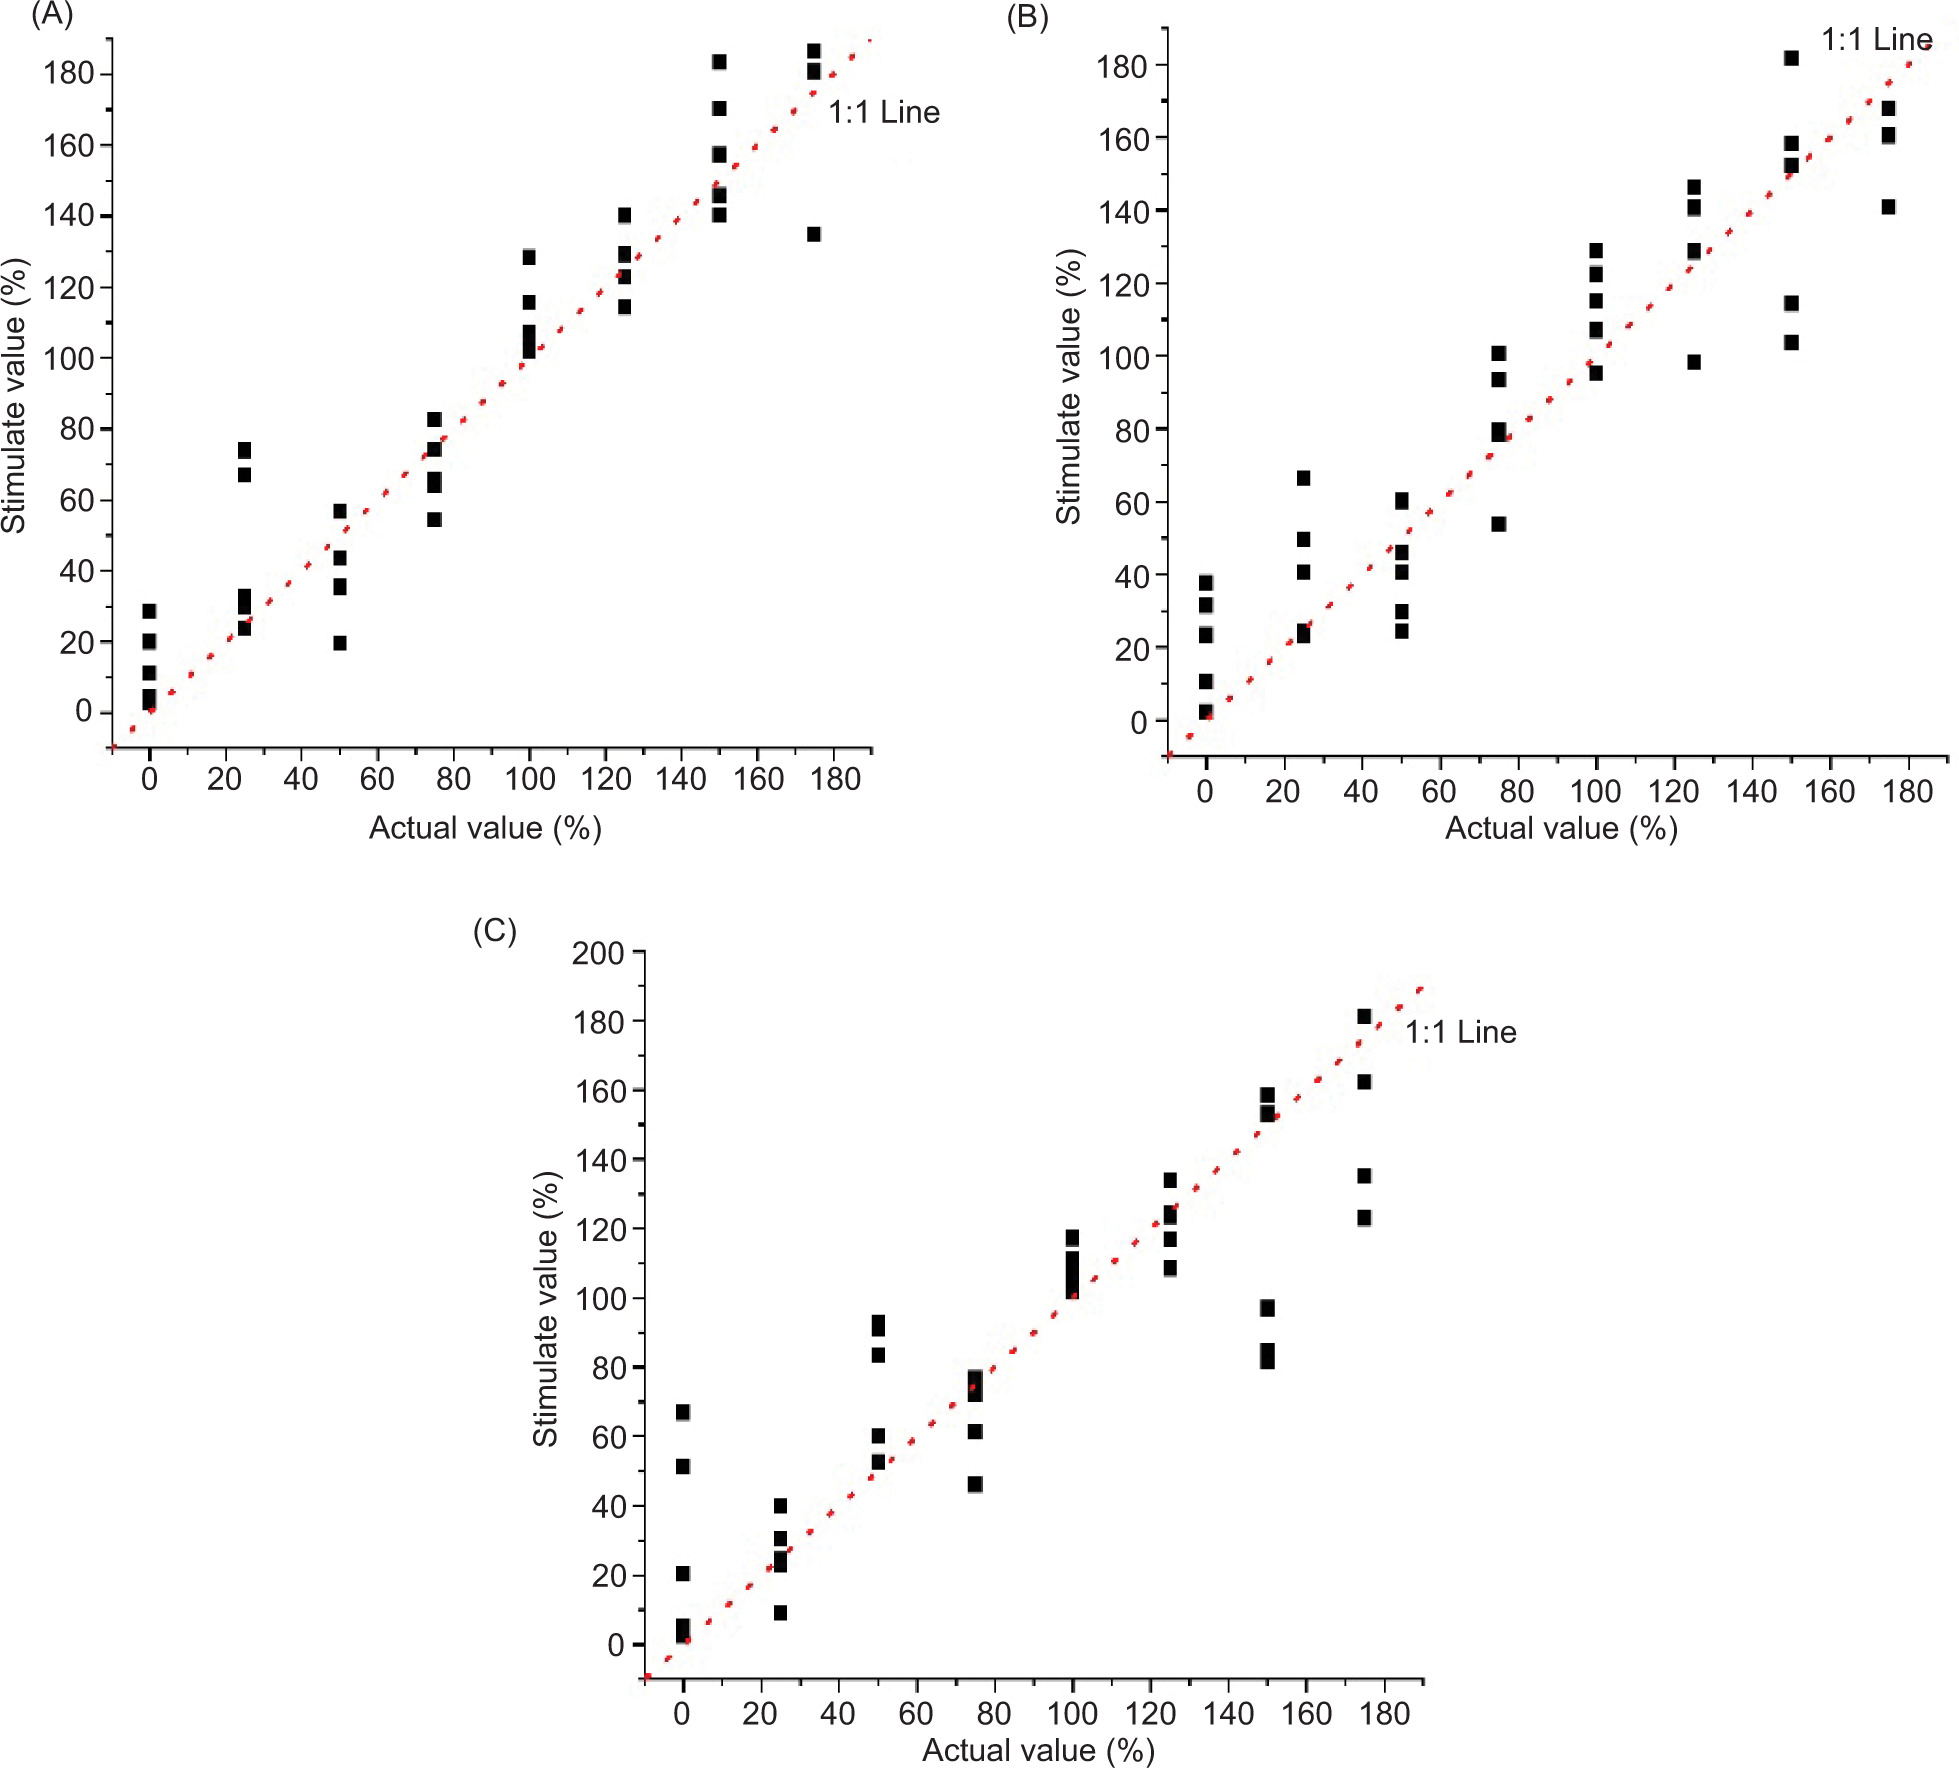
ε p = σ p E p = M p E p W = 6 F p L E p b h 2 6 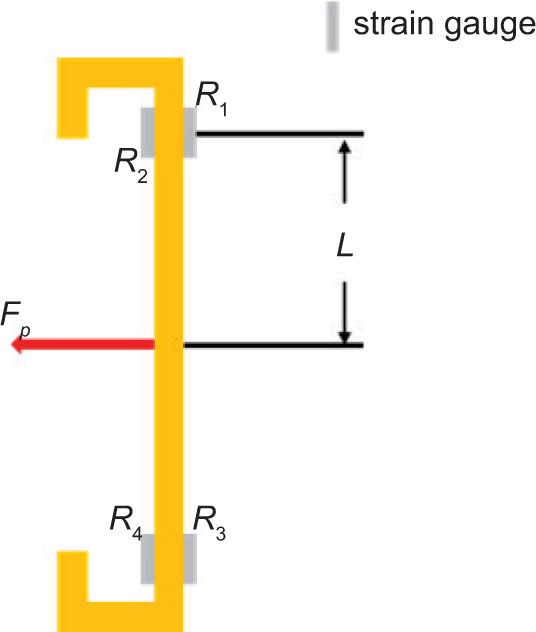
ORIGINAL ARTICLE
Study on a new nitrogen nutrition detection sensor based on stem puncture
Yong Liu1,2, Weicai Qin1, Yanshan Yang1, Yafei Wang2, Bin Wang2, Qiang Shi2,3*, Mengdie Xu4, Hanping Mao2
1Facility Agriculture Intelligent Equipment Engineering Technology Research and Development Centre, Suzhou Polytechnic Institute of Agriculture, Suzhou, Jiangsu Province, China;
2School of Agricultural Engineering, Jiangsu University, Zhenjiang, Jiangsu Province, China;
3School of Science and Technology, Shanghai Open University, Shanghai, China;
4Institute of science and technology information, Jiangsu University, Zhenjiang, Jiangsu Province, China
Abstract
This report presents a wearable nitrogen (N) detection sensor based on a stem puncture methodology. Analysis of variance (ANOVA) was employed for statistical evaluation of the experimental data, and the relationship between stem mechanical characteristics and different N treatments was analyzed. The results showed that determination coefficients (R2) of the N detection models based on stem penetration and epidermal break distance were significantly lower compared to the model based on stem epidermal penetration. Consequently, the latter model was selected for further development. This study developed a wearable detection sensor for N nutrition by combining the detection model, a 3D-printed fixed skeleton, and a micro motor. The efficacy of the sensor was high in N detection, with R2 and RMSE values of 0.9046 and 12.3 g, respectively, based on a 1:1 straight line. These results were comparable to established N content estimation methods employing spectral technology (R2 range: 0.882–0.980). Furthermore, experimental observations indicated that the wearable sensor had minimal adverse effects on Cucumis sativus growth. Therefore, the proposed wearable N detection sensor was demonstrated to be simple, sensitive, and biocompatible, offering a viable approach for rapid detection of stem mechanical characteristics for crop nutrition.
Key words: greenhouse cucumber, nutrient stress, puncture, stem, wearable detection
*Corresponding Author: Qiang Shi, School of Agricultural Engineering, Jiangsu University, Zhenjiang, Jiangsu Province, China. Email: [email protected]
Academic Editor: Amin Mousavi Khaneghah, PhD, DSc, Faculty of Biotechnologies (BioTech), ITMO University 191002, 9 Lomonosova Street, Saint Petersburg, Russia
Received: 15 October 2024; Accepted: 13 April 2025; Published: 4 July 2025
© 2025 Codon Publications
This is an Open Access article distributed under the terms of the Creative Commons Attribution-NonCommercial-ShareAlike 4.0 International (CC BY-NC-SA 4.0). License (http://creativecommons.org/licenses/by-nc-sa/4.0/)
Introduction
With the rapid development of computer technology, sensor technology, and information processing technology, wearable intelligent sensors that can detect body movements or health without restricting or interrupting human movements have garnered significant attention in the global research community (KIM et al., 2017). Building upon these developments, researchers have begun to investigate wearable information acquisition sensors that are flexibly attached to plant surfaces to replace traditional rigid sensors and reduce damage to plants (CHAI et al., 2021). Previous studies have established that non-contact monitoring approaches, particularly optical and remote sensing technologies, have been widely adopted as principal methods for nitrogen status diagnosis due to their demonstrated advantages in non-destructive analysis, rapid assessment, and high-throughput capacity. However, these techniques are inherently vulnerable to environmental interference. By contrast, wearable sensing technology provides enhanced temporal and spatial resolution. Notably, emerging flexible sensors have attracted considerable research interest in crop phenotyping applications owing to their remarkable mechanical adaptability and biocompatibility. Recent advancements in flexible material-based electrochemical and optical sensors have evidenced significant progress in monitoring parameters including individual plant growth dynamics, foliar moisture content, and transpiration rates. Despite these developments, substantial breakthroughs in the detection of essential crop macronutrients have yet to be achieved (Yan et al., 2024).
Surface-attached sensors
Although the development of wearable sensors for plants lags behind that of intelligent sensors for humans, numerous studies have demonstrated their efficacy in monitoring leaf surface microclimate parameters and plant organ morphogenesis (Chai et al., 2021). However, the requirements for plant volume were relatively strict, which limited the further development of this technology in the field of plant wearable sensors. Tang (Tang et al., 2019) developed a flexible GM/CNTM sensor with nanoscale detection precision, which consisted of a latex substrate at the bottom, a graphite membrane (GM) in the middle, and a carbon nanotube membrane (CNTM) on the top. The sensor exhibits dimensional adaptability to plant growth, with mechanical deformation inducing measurable resistance variations, thereby transducing growth kinetics into quantifiable electrical signals. This successfully converted the mechanical deformation caused by plant growth into a change in resistance. The advantage of this sensor lay in its ability to simultaneously overcome the limitations of GM, which could not withstand strain loads exceeding 50%, and CNTM, which tended to break into fragments and detach from the surface when stretched. This was achieved because carbon nanotubes could promptly fill the cracks formed in the graphene membrane during stretching. This synergistic enhancement effect enabled the strain limit of the carbon nanotube/graphene sensor to reach 150%. Kim et al. (2019) directly imprinted polymer electrodes on the surface of living plants, and then detected crop growth by analyzing the bioimpedance spectrum of the polymer electrodes. While these polymeric interfaces maintain stable adhesion during plant development without significantly compromising physiological processes, their implementation necessitates specialized deposition systems for high-temperature aerosol jet printing or vapor-phase polymerization.
Invasive sensors
Gao et al. (2024) systematically summarized intelligent wearable sensors based on organic electrochemical transistors (OECT) and emphasized their tunable synthesis, easy deposition, and excellent biocompatibility. Diacci et al. (2021) embedded an enzyme biosensor based on an electromechanical transistor into the vascular tissue of trees to monitor sugar fluctuations inside the trunk. However, this method is highly susceptible to interference from plant healing reactions and can only continuously monitor for 48 hours.
Stem sensors
Wearable plant sensors affixed directly on plant leaves or stems can accurately and conveniently analyze the health status of plants by detecting various biomarkers or microenvironmental parameters and converting them into quantifiable electronic signals (Chen et al., 2023). Nitrogen (N), as the fundamental constituent of nucleic acids, phospholipids, and proteins, is an essential element for the formation of cell nuclei, cell membranes, and chlorophyll in living organisms, and is also the basis for the biological characteristics of living organisms (Sevanthi et al., 2021). Thus, precise detection of N nutrition based on wearable plant sensors plays a crucial role in analyzing crop health and improving crop yield and quality. A study revealed that the mechanical characteristics of stem thorns are closely related to the content of cellulose and lignin, with cellulose having a more significant influence (Liu et al., 2024). Additionally, the study pointed out that cucumber stems healed 74% within 25 hours, and their growth and development were minimally affected by puncture. This suggests that obtaining stem mechanical characteristics through puncture has considerable potential for accurately analyzing crop N nutrition. However, currently there are very few reports on the application of wearable stem sensors—especially those assessing stem mechanical characteristics—in nutritional detection, and there is a lack of stem mechanical detection models and sensors that can indicate the degree of nutritional stress.
Therefore, this study developed a wearable sensor for detecting stem mechanical characteristics with simple preparation and minimal harm to plants by constructing a nitrogen detection model based on stem mechanical characteristics. This research provides a theoretical foundation and practical detection methods for applying stem analysis in crop nutrient information detection. Furthermore, ion-selective electrodes have become a research hotspot in wearable crop sensors. The combination of the sensor developed in this study with ion-selective electrodes holds great potential to significantly advance research on precise crop information analysis in the future.
Materials and Methods
Test location and details
The experiment was conducted in a Venlo-type greenhouse at the Key Laboratory of Modern Agricultural Equipment and Technology of the Ministry of Education, Jiangsu University, from May 2023 to July 2023. The research object was “Jinyou No.1” cucumber cultivated by Tianjin Academy of Agricultural Sciences. Seedlings were raised in a plastic hole tray on May 4, 2023, and cucumber seedlings with true leaves were transplanted into a plastic basin filled with 8 L of perlite on May 19.
Experiment design
The experiment was conducted according to the previous study (Hou et al., 2021) with a small modification. On the 10th day post-transplantation, plants were divided into experimental groups, each comprising 20 cucumber specimens. Data collection commenced seven days after group allocation. The nutrient solution was the Yamazaki formula, and it was applied once daily between 8:00 and 9:00 in the morning, with a dosage of 600 milliliters each time (Liu et al., 2022; Wang et al., 2020). The standard nutrient solution contained 168 mg/L nitrogen (N) and 234 mg/L potassium ions (K+). N treatment was set at eight levels: 0%, 25%, 50%, 75%, 100%, 125%, 150%, and 175%, while potassium (K) treatment was set at three levels: 50% (low K, LK), 100% (medium K, MK), and 150% (high K, HK). A total of 24 treatment groups were set up in the experiment, and the puncture mechanical characteristics of cucumber stems were obtained and used to construct an N nutrition detection model for greenhouse cucumbers.
Puncture Test
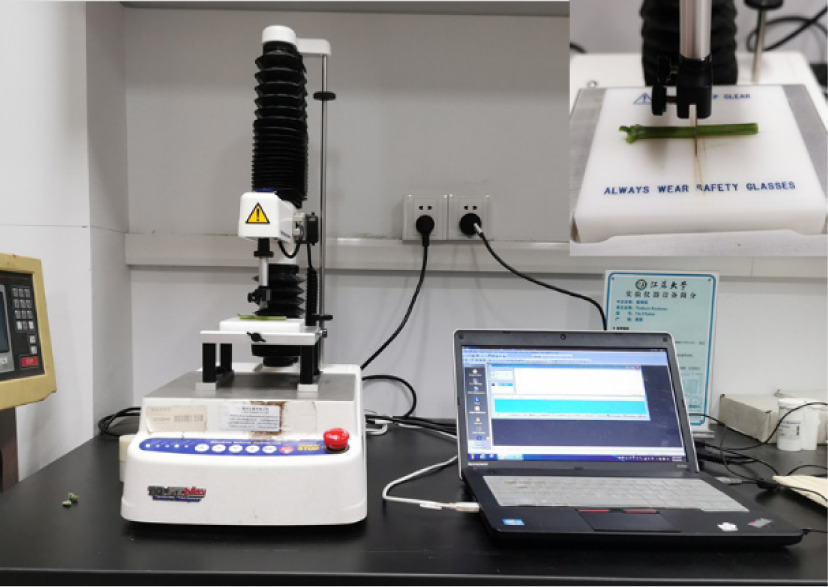
The experimental method described by Liu et al. (2024) and the texture analyzer (TA-XTPLUS, Stable Micro System, UK) were used to obtain puncture data. Each plant was repeatedly punctured three times. The penetration speed was 2 mm•s–¹, the minimum perception force was 5 g, and the puncture depth was 10 mm. The puncture was selected at the middle position of the internode, and the puncture probe was facing the axis of the stem.
According to the analysis results of a previous study, epidermal toughness and brittleness were not suitable for constructing N nutrient detection models for greenhouse cucumbers (Liu et al., 2024). Therefore, N detection models based on epidermal penetration, epidermal break distance, and stem penetration were established and used for analysis.
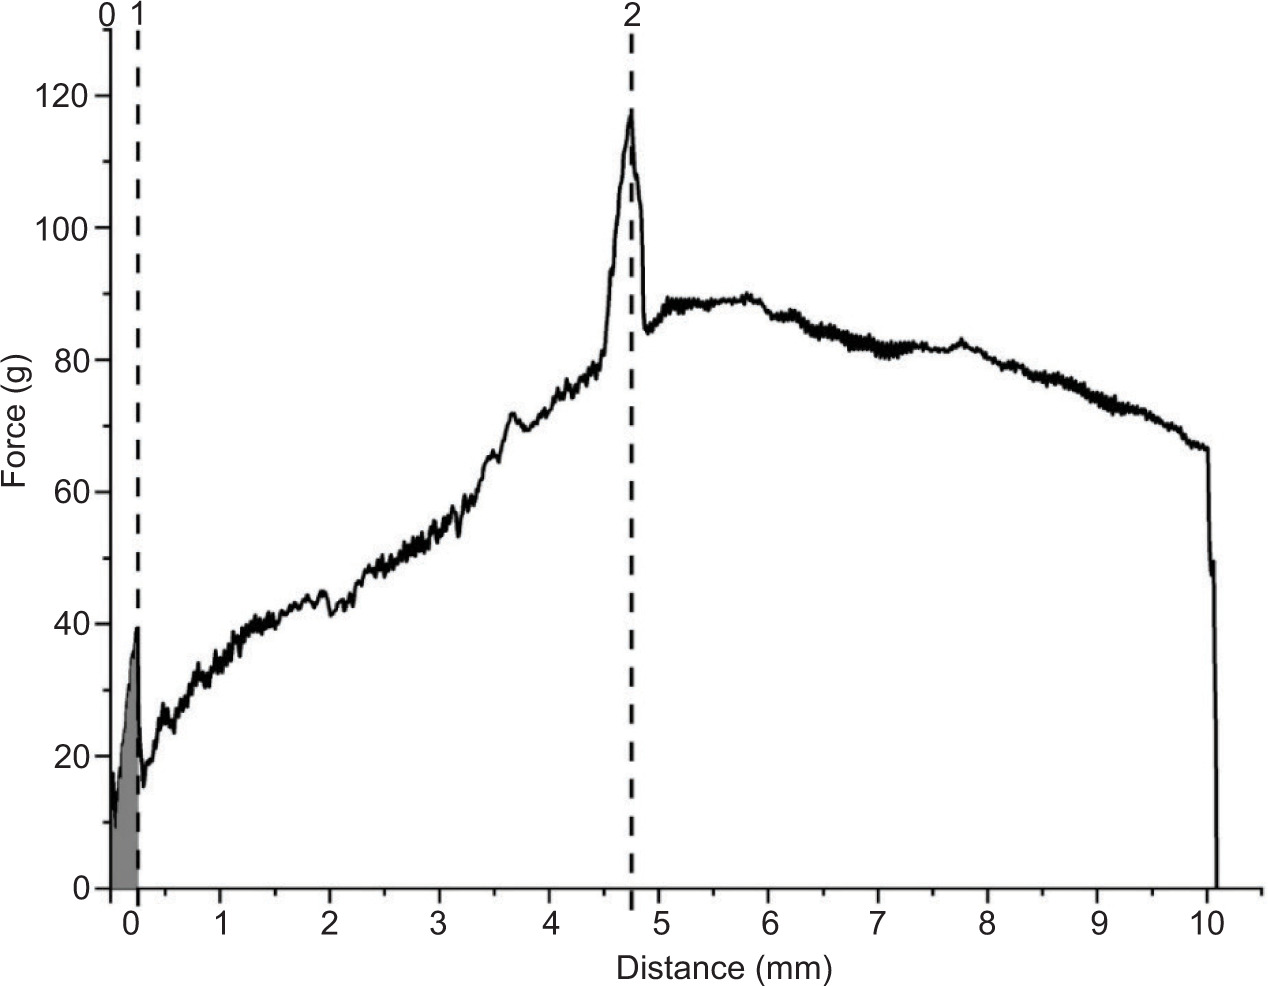
These three mechanical characteristic parameters of stem puncture are defined based on previous research (Camps et al., 2005; Liu et al., 2022). The classic force curve of cucumber stem puncture obtained through puncture experiments is shown in Figure 1 (Liu et al., 2024). Among them, (1) was the first peak; (0–1) was the operating distance of the first peak; and (2) was the maximum peak value. Thereby, the first peak of the puncture curve (1) is defined as the epidermal penetration force (g), the running distance of the first peak (0 to 1) is defined as the epidermal break distance (mm), and the maximum peak (2) is defined as the stem penetration force (g).
Figure 1. Puncture curve of a greenhouse cucumber stem measured using a texture analyzer (Liu et al., 2024).
Statistical analyses
Each experiment was repeated more than three times. Data were analyzed using analysis of variance (ANOVA) in SPSS 18 (SPSS Inc., Chicago, Illinois, USA) to investigate the performance of the detection method based on stem mechanical characteristics and its impact on plant growth. The Least Significant Difference (LSD) test was used to determine significance at a significance level of p < 0.05.
N nutrient detection models
Construction of N nutrient detection models
According to the analysis (Liu et al., 2024), the mechanical characteristics of stems exhibited a significant indicative effect on the amount of N application, laying a solid foundation for utilizing stem mechanical characteristics in N diagnosis. Due to the inapplicability of employing epidermal toughness and brittleness to construct N nutrient detection models for greenhouse cucumbers, N detection models based on epidermal penetration, epidermal break distance, and stem penetration were ultimately established and employed for analysis.
In the experiment, each treatment included 10 cucumber plants, with a total of 240 samples. Eight cucumber plants were randomly selected for each treatment, forming a modeling set of 192 samples to construct an N nutrition detection model for cucumbers. The remaining 48 samples, along with 72 independent samples, formed the validation set to verify the effectiveness of the model. The N detection model based on epidermal penetration force, epidermal break distance, and stem penetration force is shown in Table 1.
Table 1. Nitrogen nutrition was measured by mechanical characteristics of stem.
| Application of K | x | Detection model | R2 |
|---|---|---|---|
| MK | Epidermal penetration force | y=–8.36x1+410.23 | 0.9655 |
| Epidermal break distance | y=1908.97x2–253.04 | 0.8583 | |
| Stem penetration force | y=–1.24x3+289.62 | 0.9099 | |
| HK | Epidermal penetration force | y=–5.22x1+293.93 | 0.9509 |
| Epidermal break distance | y=–1974.56x2+408.44 | 0.8699 | |
| Stem penetration force | y=–1.51x3+348.44 | 0.8454 | |
| LK | Epidermal penetration force | y=–13.98x1+606.26 | 0.909 |
| Epidermal break distance | y=–1602.70x2+477.69 | 0.8267 | |
| Stem penetration force | y=-1.80x3+338.09 | 0.7608 |
Note: y represents the degree of N stress, x1, x2 and x3 represent epidermal penetration, epidermal break distance and stem penetration.
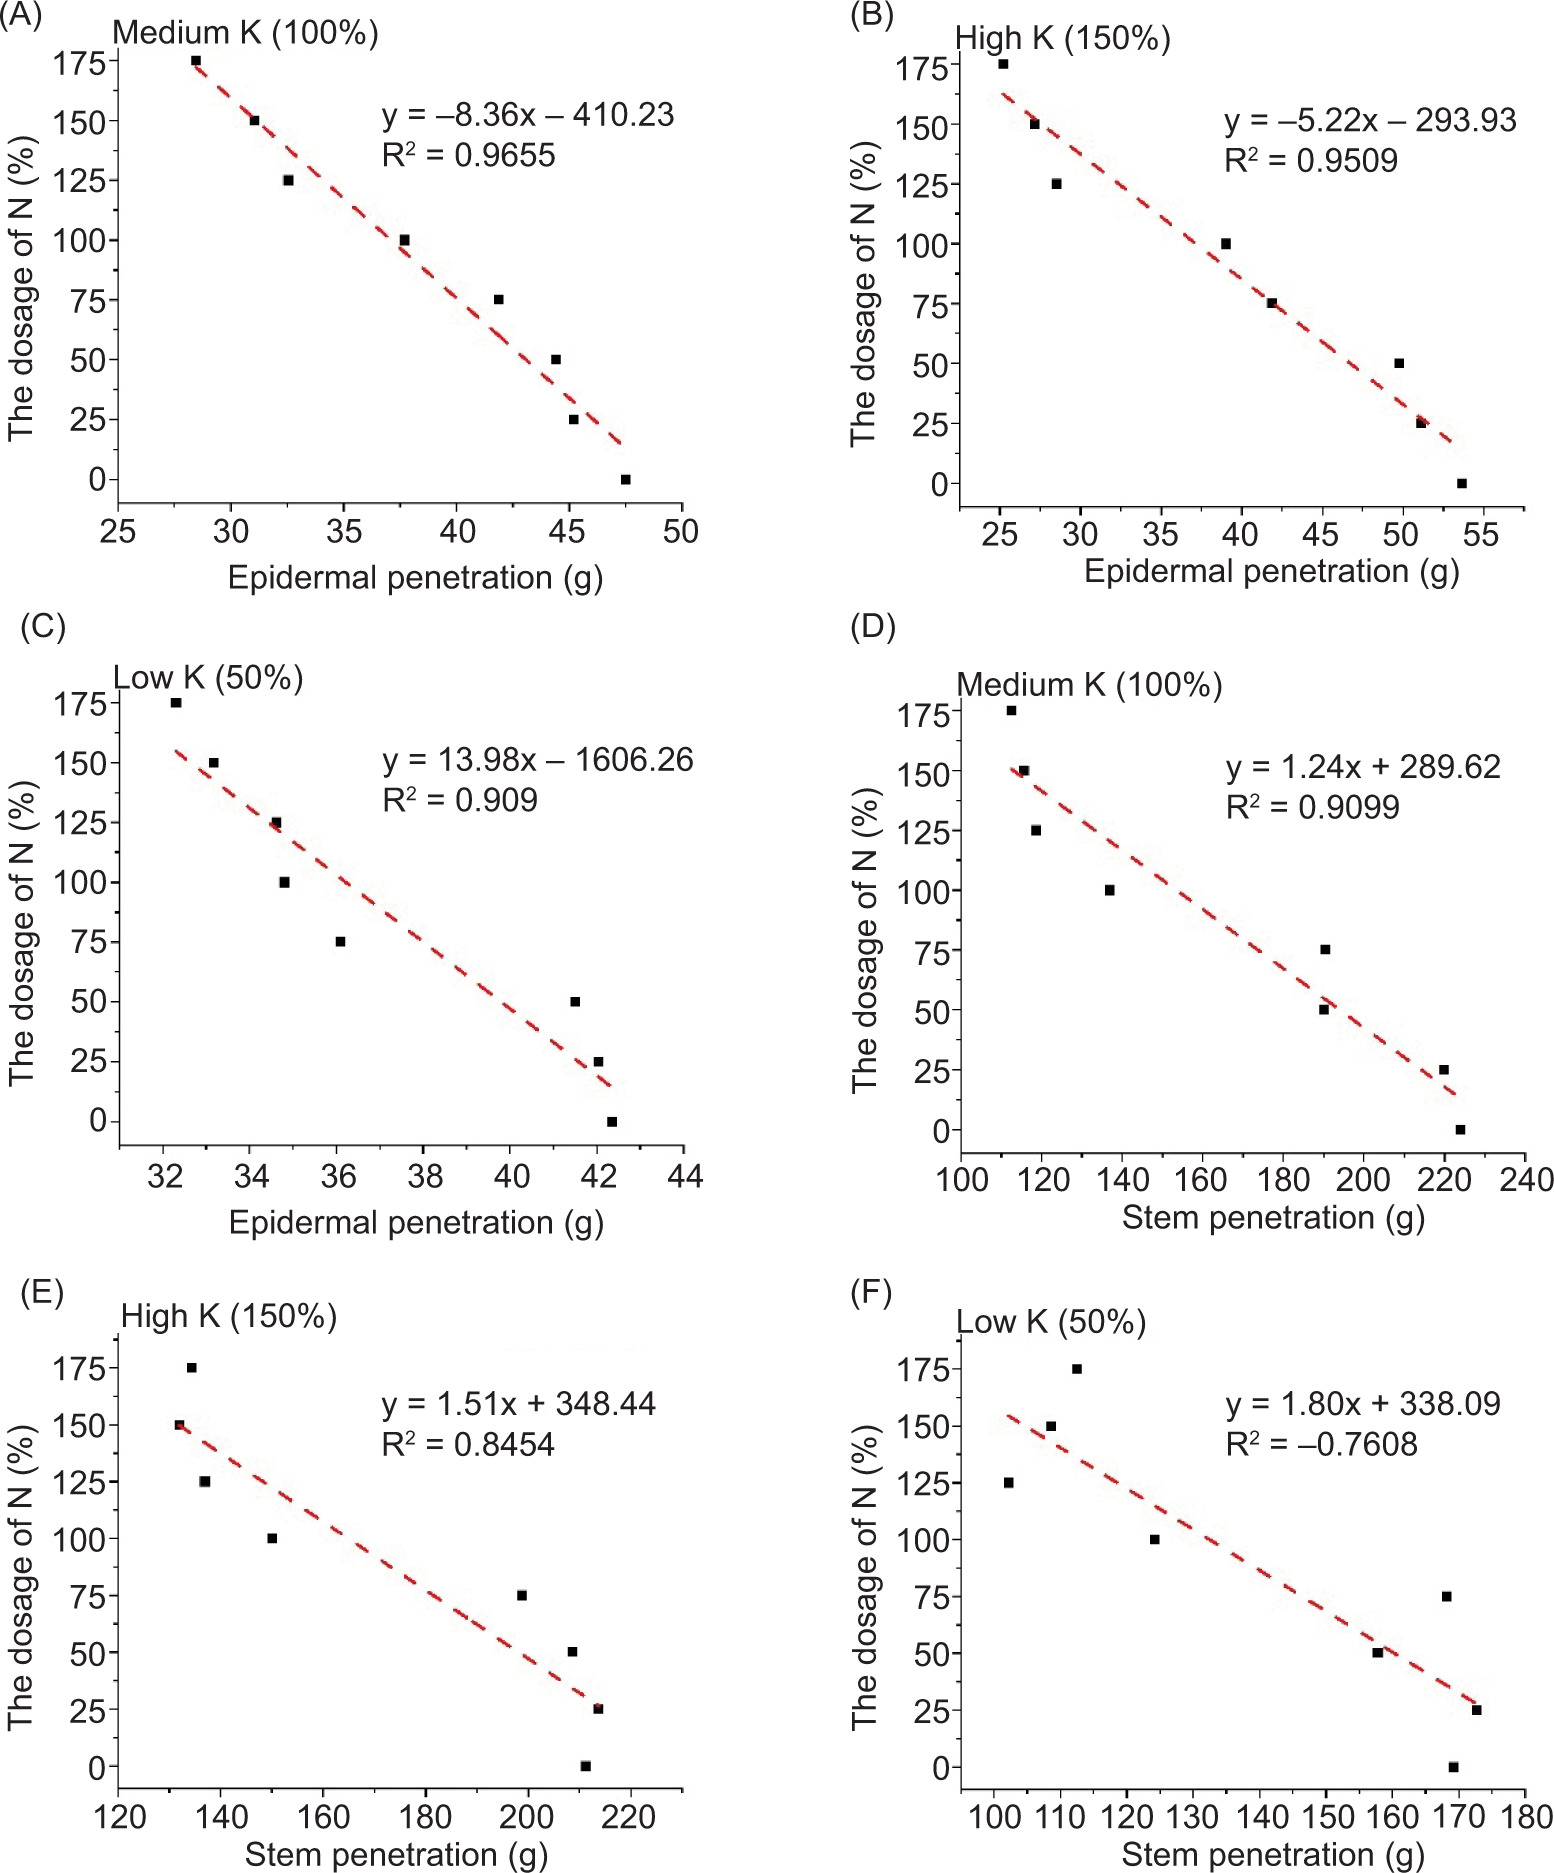
From Figures 2A–C, it is evident that under MK, LK, and HK treatments, the R2 of the N detection model based on stem epidermal penetration was 96.55%, 95.09%, and 90.9%, respectively. These results indicate good model efficacy for N supply assessment regardless of independent or combined N-K stress conditions. According to Figures 2D–F, under MK, LK, and HK treatments, the R2 values of the N detection model based on stem penetration were 90.99%, 84.54%, and 76.08%, respectively. This indicates that the detection accuracy of stem penetration on N application was significantly lower than that of the N detection model based on stem epidermal penetration.
Figure 2. N detection model based on stem epidermal penetration (A) N stress under MK treatment, (B) N stress under HK treatment, (C) N stress under LK treatment; and stem penetration, (D) N stress under MK treatment, (E) N stress under HK treatment, (F) N stress under LK treatment. The model based on epidermal penetration demonstrated optimal performance, maintaining stable predictive accuracy under both individual and combined N-K stress conditions. This minimally invasive approach only requires epidermal penetration, causing negligible plant damage while promoting rapid wound healing. The stem penetration force-based model showed inferior performance, with its R2 for nitrogen detection declining to 76.08% under HK treatment. Furthermore, the necessity of complete stem penetration significantly reduces its practical applicability in field conditions.
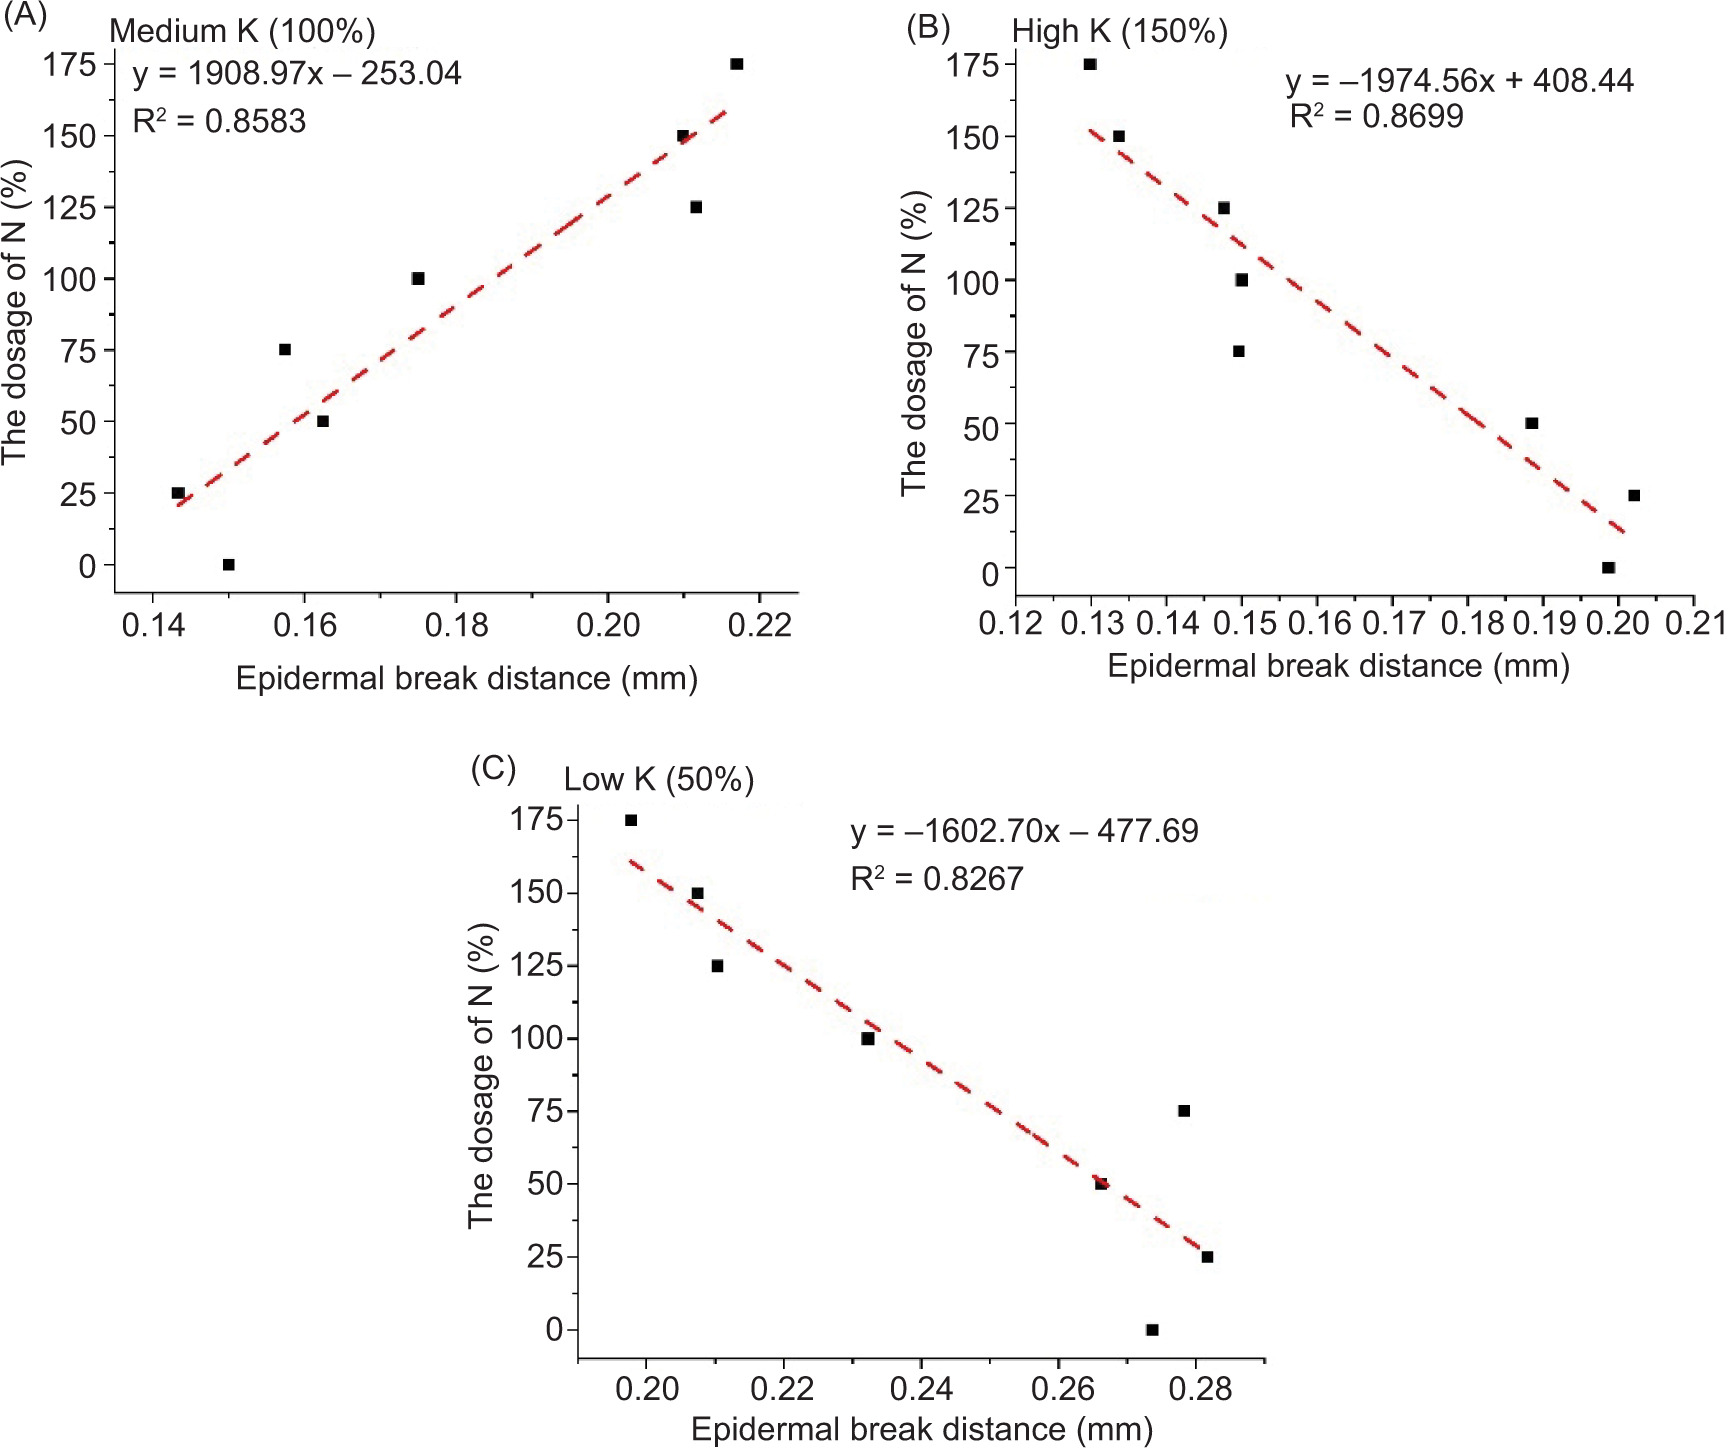
According to Figure 3, under MK, LK, and HK treatments, the R2 values of the N detection model based on epidermal break distance were 0.8583, 0.8699, and 0.8267, respectively, and these values were still lower than those of the N detection model based on epidermal penetration. Additionally, under MK treatment, the epidermal break distance of stems was positively correlated with N application, while under LK and HK treatments, inverse relationships were observed. The reason could be that under MK treatment, K supply was sufficient, so the epidermal break distance of cucumber stems was mainly influenced by the content of structural carbohydrates and the composition of the cell wall structure. With the increase of N application rate, the content of cellulose and lignin in cucumber stems gradually decreased, leading to a decrease in the compactness of cell walls (Xue et al., 2016). Therefore, the epidermal break distance of cucumber stems was positively correlated with the amount of N applied under MK treatment.
Figure 3. N stress detection model based on stem epidermal break distance. The model based on epidermal break distance exhibited the weakest performance among all evaluated models, with R2 values consistently below 87% across all experimental conditions. (A) Relationships between epidermal break distance and N stress under MK treatment; (B) N stress under HK treatment; (C) N stress under LK treatment.
According to the above analysis, the R2 of the N detection models based on stem penetration and epidermal break distance were significantly lower compared to the N detection model based on stem epidermal penetration. Specifically, the R2 of the N detection model based on epidermal break distance did not exceed 0.87 under MK, LK, and HK treatments. Moreover, because the response of cucumber stem epidermal break distance to N application under LK and HK treatments was mainly affected by the water status of epidermal cells, cell osmotic pressure balance, and intercellular space, the detection accuracy of the model based on epidermal break distance was easily reduced due to interference from crop K+ transport mechanisms.
The N detection model based on stem penetration achieved an R2 of over 0.9 under MK treatment, but the R2 under HK treatment was only 0.7608, markedly lower than the 0.909 of stem epidermal penetration. Moreover, the N detection model based on stem penetration force required puncturing the stem, while the N detection model based on stem epidermal penetration force only needed to puncture the epidermis. This caused less damage to crops and was beneficial for the rapid healing of puncture wounds, providing convenience for the next test. Ultimately, a N detection model based on stem epidermal penetration was established, and its effectiveness was tested using a validation set.
Validation of N detection model based on epidermal penetration force
According to the above research, the epidermal penetration force of greenhouse cucumber stems was mainly regulated by external N application; that is, the epidermal penetration force gradually decreased with the increase of N application amount. Therefore, the relationship between stem epidermal penetration force (epidermal penetration, Ep) and N application rate is shown in formula (1).
Ep = η – τ • N(1)
where N represents the level of N application (%); Ep represents stem epidermal penetration force (g); τ is the slope of the model, and according to the experimental results, its value under MK treatment is 0.116; η is the intercept of the model, and according to the experimental results, its value under MK treatment is 48.747.
The epidermal penetration of greenhouse cucumber stems was also influenced by the supply of K+. In theory, the intercept (η) of a cucumber N nutrient detection model based on stem epidermal penetration represents the impact of external K+ supply on stem epidermal penetration without considering external N application rates (when N = 0%, Ep = η).
According to previous analysis, LK treatment exerted an inhibitory effect on the stem epidermal penetration force, while HK treatment enhanced this parameter. Therefore, the influence factor k1 was introduced into formula (1) to represent the effect of K+ on the stem epidermal penetration force, as shown in formula (2). Under LK treatment, the intercept of the cucumber N nutrition detection model based on epidermal penetration was 42.808, while under HK treatment, the intercept was 55.595. Compared with the intercept under MK, the intercept under LK treatment decreased by 1.1389 times, while the intercept under HK treatment increased by 1.1404 times. Therefore, the influence factor of the slope, obtained by taking the average value, was 1.1397.
The experimental data revealed differential effects of potassium treatments on stem epidermal penetration resistance. Given the inhibitory effect of LK treatment, the measured values required division by the influence factor (k1), mathematically equivalent to multiplication by its reciprocal. Conversely, HK treatment demonstrated a significant enhancement effect, necessitating multiplication by k1. Accordingly, the coefficient i in Equation (2) was assigned values of 1, 0, and –1 for HK, MK, and LK treatments, respectively. The experimentally derived value of k1 was determined to be 1.1397 through quantitative analysis.
Where ki1 represents the influencing factors of K+.
Additionally, the effect of K+ on the stem epidermal penetration force significantly affected the slope of the N detection model. For example, HK treatment exacerbated the impact of N stress on crops, leading to an enhanced effect of N on stem epidermal penetration and an increase in the slope of the N detection models.
Under LK treatment, the slope of the cucumber N nutrition detection model based on epidermal penetration was –0.065, while under HK treatment, the slope was –0.1835. Compared with the slope under MK treatment, the slope under LK treatment decreased by 1.7846 times, while the slope under HK treatment increased by 1.5819 times. The influencing factor of the slope was found to be 1.6833 through weighted averaging. Therefore, k2 was added to the formula (2) to represent the effect of K+ on the model slope, as shown in formula (3). In the formula, the values of i were 1, 0, and −1, corresponding to HK, MK, and LK treatments, respectively. The value of k2 was set to 1.6833 based on the experiment.
Therefore, the N detection model based on stem epidermal penetration can be represented by the transformed formula (4).
Formula (4) was simplified to obtain formula (5).
Where N represents the level of N application, %; Ep represents stem epidermal penetration force, g.
The N detection model based on stem epidermal penetration was validated using an independent validation dataset, with performance metrics illustrated in Figure 4. The simulated value represented the N application level predicted by the N detection model based on stem epidermal penetration, while the actual value corresponded to the true N application level. The results showed that under MK treatment, the R2 and RMSE of the simulated versus actual values of the N stress detection model were 0.9398 and 34.9%, respectively. Under HK treatment, the R2 and RMSE were 0.9190 and 38.12%, while under LK treatment, they were 0.8676 and 45.1%. These findings confirm that the introduction of influencing factors significantly improved the accuracy of the model.
Figure 4. Validation of the N detection model based on stem epidermal penetration. (A) Comparison between simulated and actual values of the model under MK treatment; (B) Comparison between simulated and actual values of the model under HK treatment; (C) Comparison between simulated and actual values of the model under LK treatment.
Design and Experiment of Wearable Detection Sensor
Structure of wearable detection sensor for N and K information
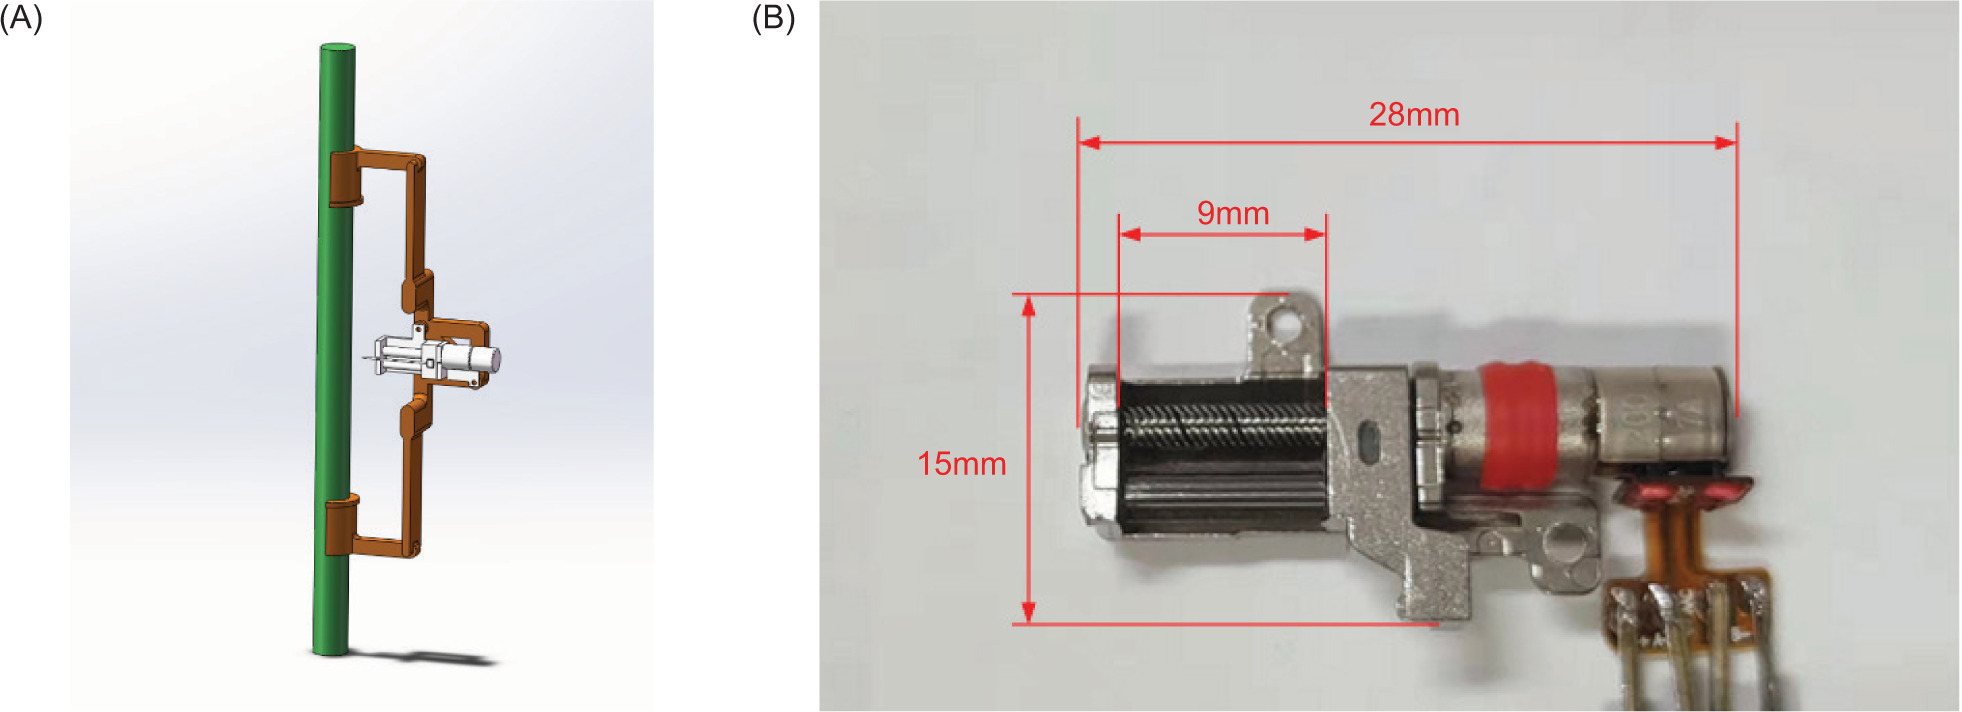
The structure of the wearable sensor is shown in Figure A1. The system comprises four principal components: a micro stepper motor, a fixed base, a puncture probe, and an integrated control unit. The micro stepper motor, mounted on the fixed base, interfaces with the control unit through electrical connections. The motor and probe are rigidly connected, and the puncture probe is controlled to move back and forth along the slide rail by timing the output pulses of the control system, thereby achieving the insertion and retrieval of the puncture probe.
Design of fixed base for puncture force measurement
The motor drove the probe to puncture the cucumber stem, and the fixed base used for puncture force measurement also deformed due to the reaction force generated during puncture. Therefore, the puncture force could be detected by measuring the strain of the fixed base. Since wearable detection sensors need to be attached to the surface of plant stems for extended periods, the lightweight nature of the fixed base was an important design consideration. Photosensitive resin, with an elastic modulus of 2.46 GPa, demonstrated superior chemical resistance, tensile strength, and adaptability to strong light irradiation and high humidity environments. Nylon, another common 3D printing material with an elastic modulus of 1.7 GPa, is non-toxic, lightweight, and offers excellent wear and corrosion resistance. Therefore, photosensitive resin and nylon were selected as printing materials for the fixed bases and subsequently compared.
According to preliminary experiments, a force of 20–55 g was required for the puncture probe to penetrate the stem epidermis. Strain can be calculated as the ratio of stress to elastic modulus, and the relationship between force and strain on the tested piece is expressed in formula (6). The simplified structure of the fixed base used for puncture force measurement is shown in Figure 5.
Figure 5. Structural diagram of the fixed base for puncture force measurement.
where εp represents the strain of the strain gauge; σp is the stress of the tested piece, Pa; Ep is the elastic modulus of the base material, Pa; Mp is the bending moment, N•m; Fp is the force exerted on the test piece, N; W is the bending section coefficient, m4; L is the distance from the point of force application to the strain gauge measuring point (m); b is the width of the test piece (m); and h is the thickness of the test piece (m).
The optimal dimensions of the force measurement base were determined through analytical calculations to accommodate the characteristic epidermal penetration force range of 20–55 g. Mechanical analysis revealed an inverse relationship between strain magnitude and both the cross-sectional area and the moment arm length. To maximize detection sensitivity, L was set to 0.035 m, while the thickness (h) and width (b) of the tested piece were set to 0.0015 m and 0.007 m, respectively.
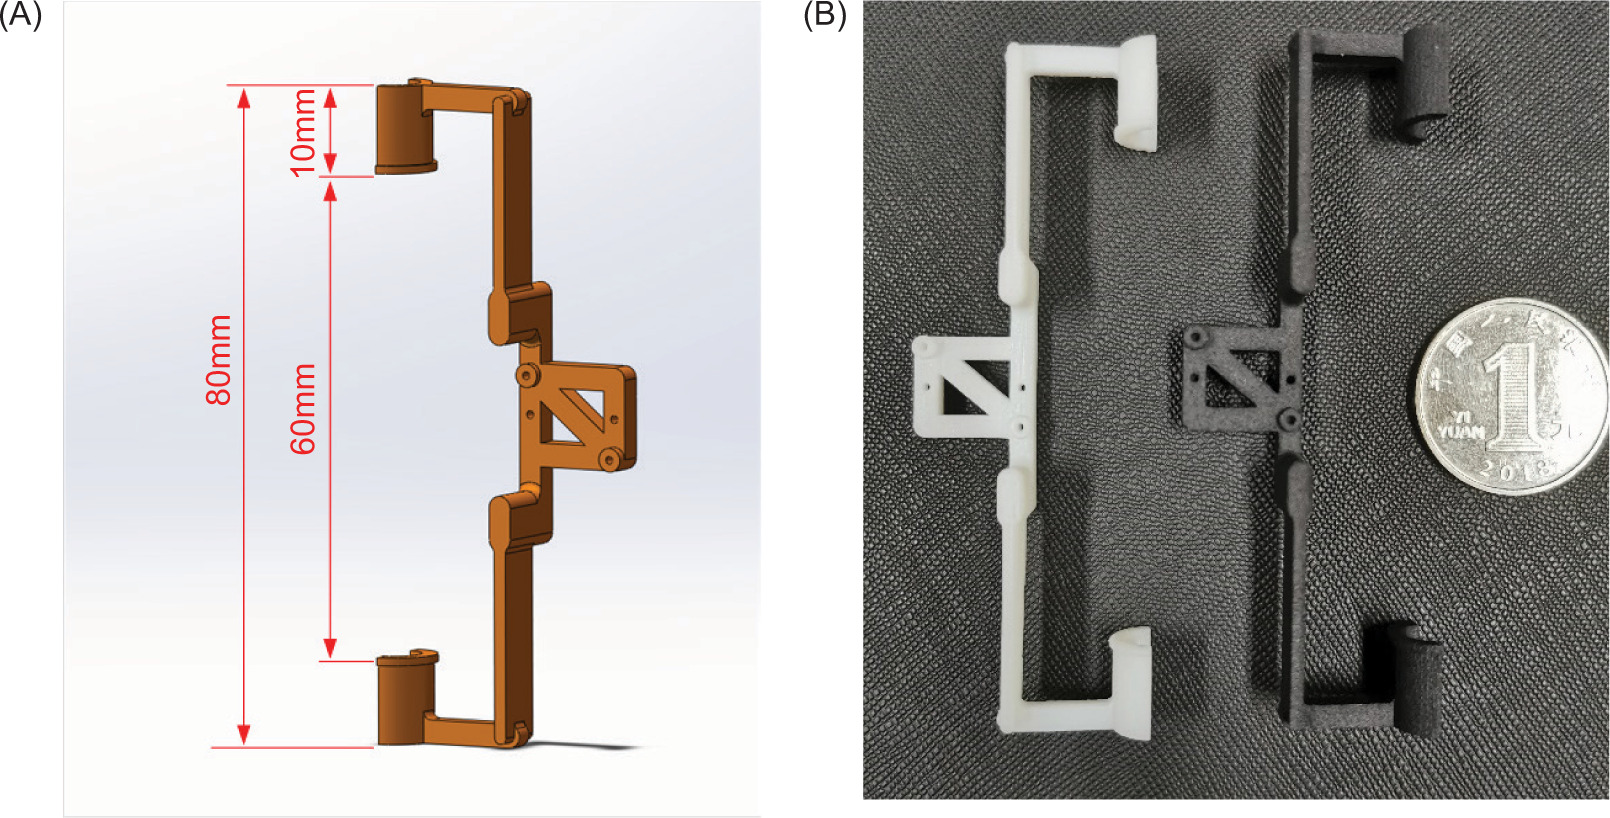
The total length of the fixed base was 80 mm, with two screw holes located in the central installation area for mounting the stepper motor. This installation area featured a sunken design to ensure that the puncture probe could penetrate vertically along the axis of the cucumber stem. Both the upper and lower sides of the fixed base included curvilinear clamping elements designed to fit the stem, thereby ensuring the stability of the wearable detection sensor. Each curved fixing component at the ends of the fixed base measured 10 mm in length, and the distance between the two fixing components was 60 mm, providing sufficient working space for the puncture probe’s operation.
Experimental study on puncture force detection
Puncture force calibration experiment
During probe penetration into the cucumber stem, reaction forces caused measurable deformation in the fixed base. The epidermal penetration force of the stem, defined as the force required to puncture the epidermis, was quantitatively determined through strain measurements of the fixed base.
To further explore the relationship between strain and force on the fixed base and to optimize material selection, fixed bases made of photosensitive resin and nylon were fabricated. The strain-force relationship of the two bases was then compared and analyzed. The strain gauge (AVIC Measurement Instrument Co., Ltd) used had sensitive grating dimensions of 1.0 mm in length and 1.9 mm in width. Its substrate measured 4.3 mm × 3.5 mm, with a resistance value of 120 Ω and a strain limit of 2.0%.
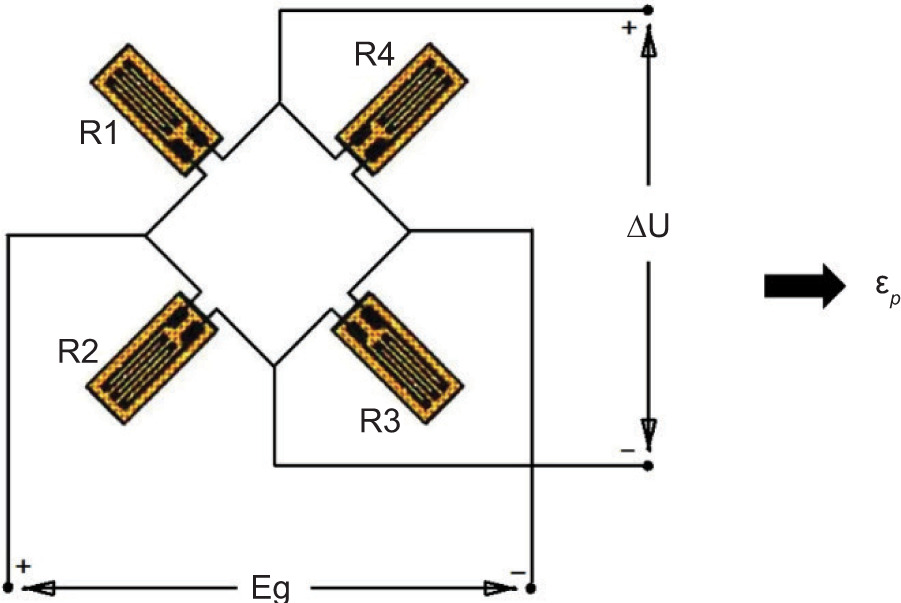
After the fixed base was thoroughly polished and cleaned, strain gauges were bonded to its surface using cyanoacrylate adhesive, as illustrated in Figure 5. Four strain gauges were arranged in a full Wheatstone bridge configuration, as shown in Figure 7.
Figure 6. Fixed base. (A) 3D model; (B) Physical image.
Figure 7. Structure drawing of the whole bridge.
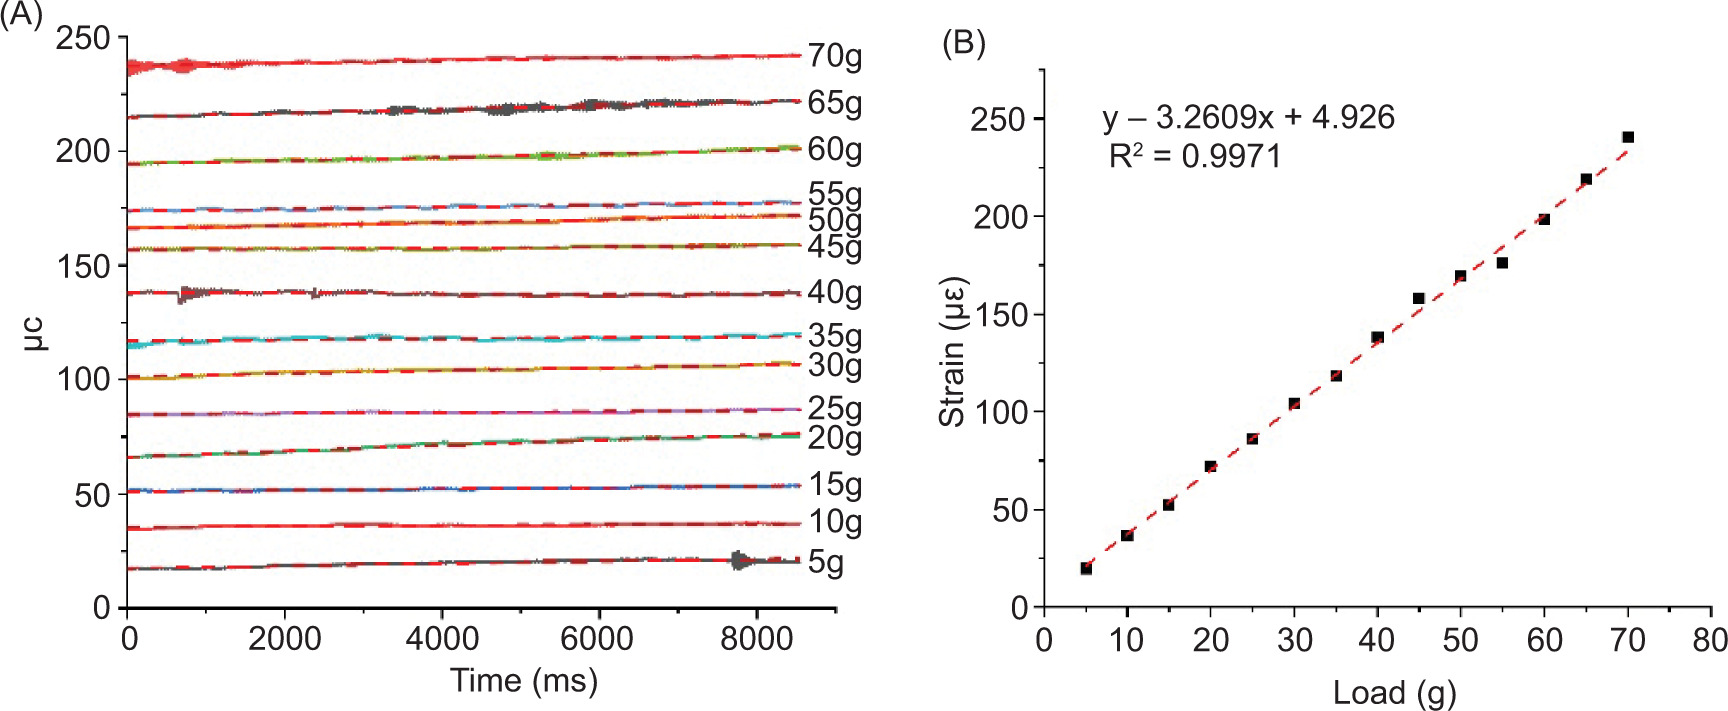
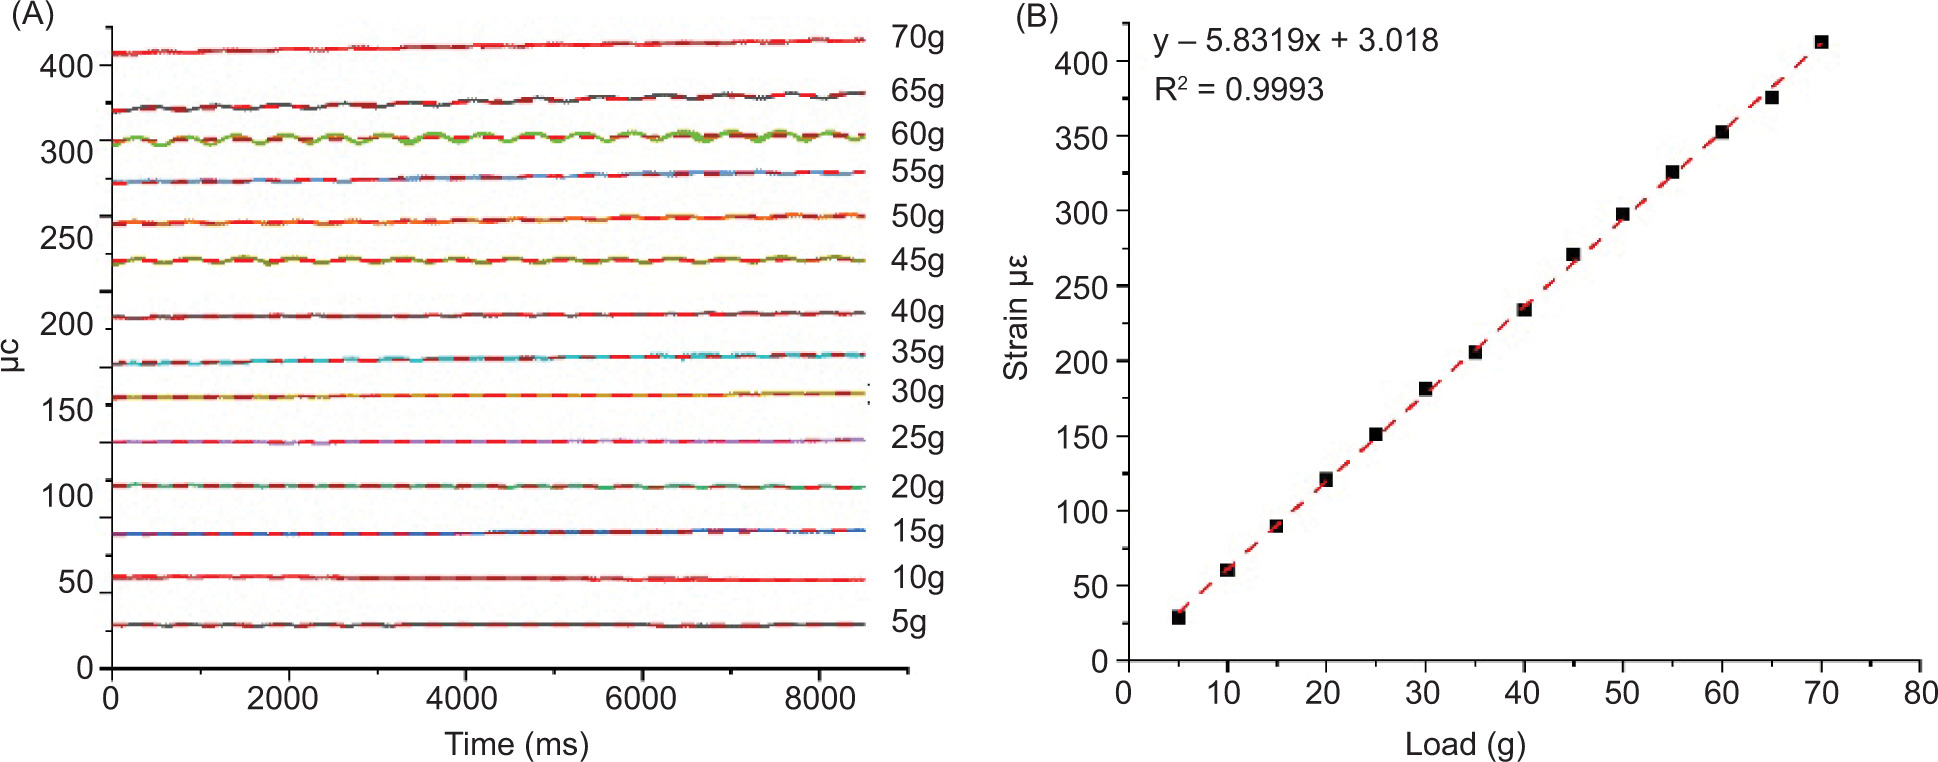
A series of calibrated weights were applied to the force measurement base in the direction of the puncture force, and the corresponding strain measurements were recorded under varying loads. The strain test results for the photosensitive resin fixed base under different loads are shown in Figure 8. The dashed line in Figure 8A represents the smoothed strain curve obtained after digital filtering using Origin software. The strain curves exhibit clear load-dependent behavior, with strain magnitude progressively increasing as the applied load increases. This monotonic relationship confirms that the fixed base undergoes elastic deformation within the tested load range.
Figure 8. Relationship between strain and load on a photosensitive resin fixed base. (A) Strain curves under different loads, (B) Relationship between strain and load.
The strain variation of the nylon material fixed base under different loads is presented in Figure 9. As shown in Figure 9A, the strain of the nylon fixed base varied significantly with applied load, and its strain curve was more stable compared to that of the photosensitive resin fixed base. The R2 values for the strain-load relationship exceeded 0.99 for both materials. Specifically, the R2 for the nylon fixed base was 0.9993, surpassing that of the photosensitive resin fixed base, which was 0.9971. Notably, the strain curves of the photosensitive resin fixed base showed minimal differences under loads of 50 g and 55 g. Furthermore, the strain range of the nylon fixed base (29 to 412 microstrain) was substantially greater than that of the photosensitive resin fixed base (19 to 240 microstrain).
Figure 9. Relationship between strain and load of nylon fixed base.
Consequently, the nylon fixed base was selected for the fabrication of wearable detection sensors due to its superior strain response. The strain-force relationship for the nylon fixed base is expressed by formula (7).
Fp = 0.1715 × εp – 0.5175 (7)
Where Fp is the force exerted on the test piece, i.e. the epidermal penetration force, N.
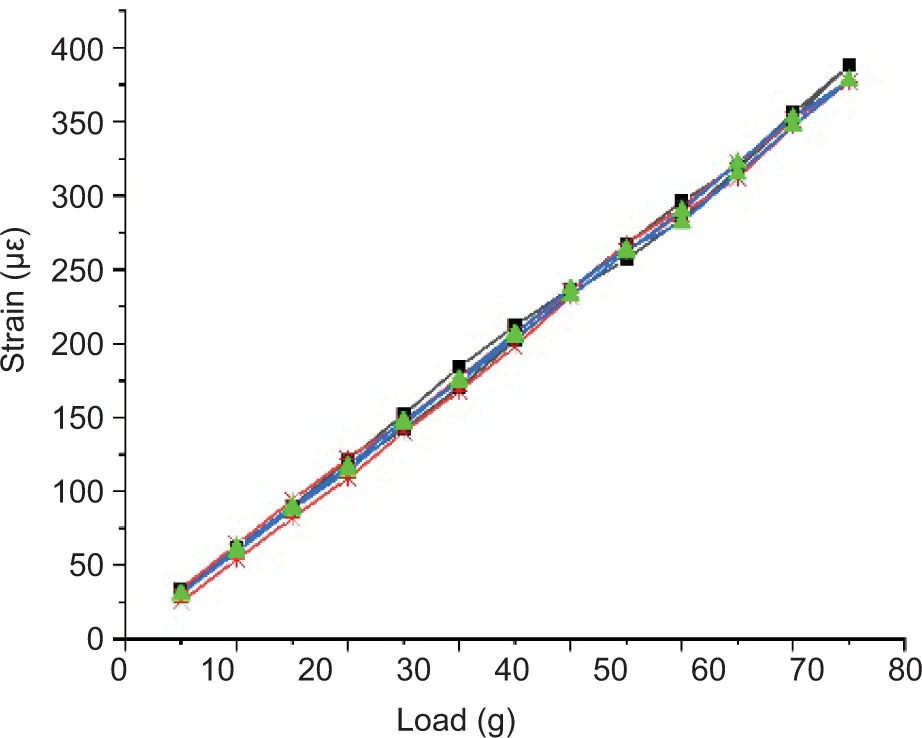
The strain measurement for the nylon fixed base began at a 5 g load, increasing incrementally by 5 g steps until reaching a maximum load of 65 g. Following this loading phase, systematic unloading was performed in 5 g decrements, during which the corresponding strain values of the base were recorded. This complete loading–unloading cycle was repeated three times to assess the reproducibility of strain measurements across different load conditions. As illustrated in Figure 10, the nylon fixed base exhibited consistent and reliable strain reproducibility throughout the entire tested load range.
Figure 10. Repeatability experiment of fixed base with nylon material.
Detection effect of wearable sensors on the penetration force of stem epidermis
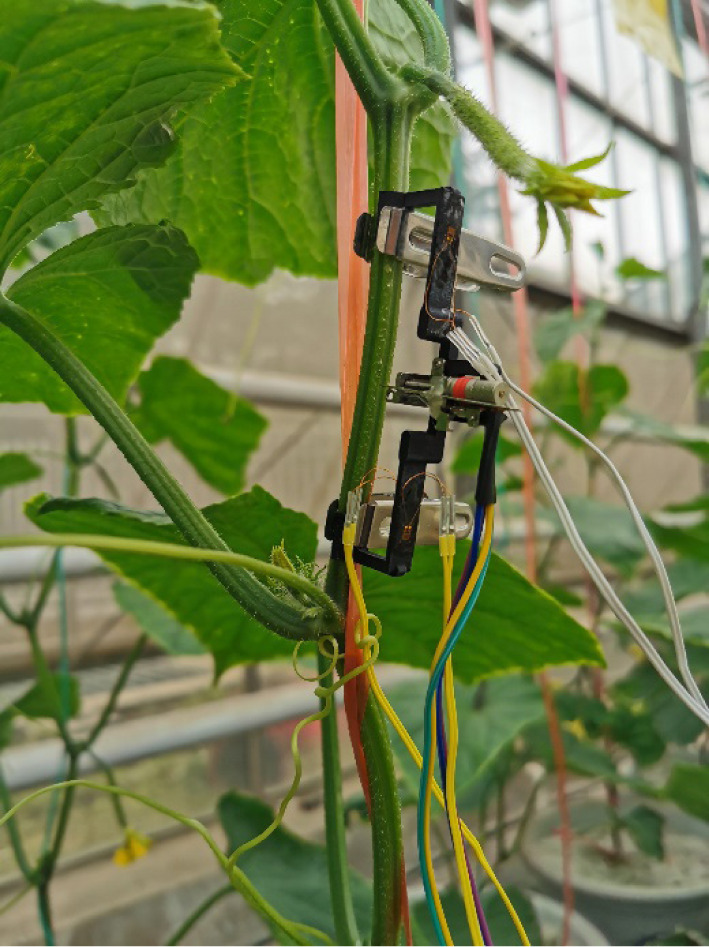
The installation of the wearable N detection sensor is illustrated in Figure 11. The motor was mounted on the force measurement base, ensuring that the puncture force was applied along the axis of the base in the opposite direction.
Figure 11. Schematic diagram of sensor installation.
Upon sensor activation, the probe moved to penetrate the cucumber stem. The resulting strain gauge output was then applied to formula (7) to calculate the epidermal penetration force of the greenhouse cucumber stem. Finally, the N detection model based on stem epidermal penetration was used to diagnose N nutrition in greenhouse cucumbers.
The wearable detection sensor was affixed to the stem surface of greenhouse cucumbers, and strain changes in the sensor’s base during the puncture process were recorded. Based on previous research (Liu et al., 2024), the internode between the 4th and 5th from the top was identified as the optimal site for analyzing puncture mechanical characteristics. Therefore, puncture experiments across various treatments were performed on the fifth internode of cucumber plants to minimize the influence of internode variability on the results. Additionally, the puncture probe was precisely aligned with the stem’s depression and oriented along the stem axis to avoid measurement errors caused by the complex tissue structure typically present at the stem edges.
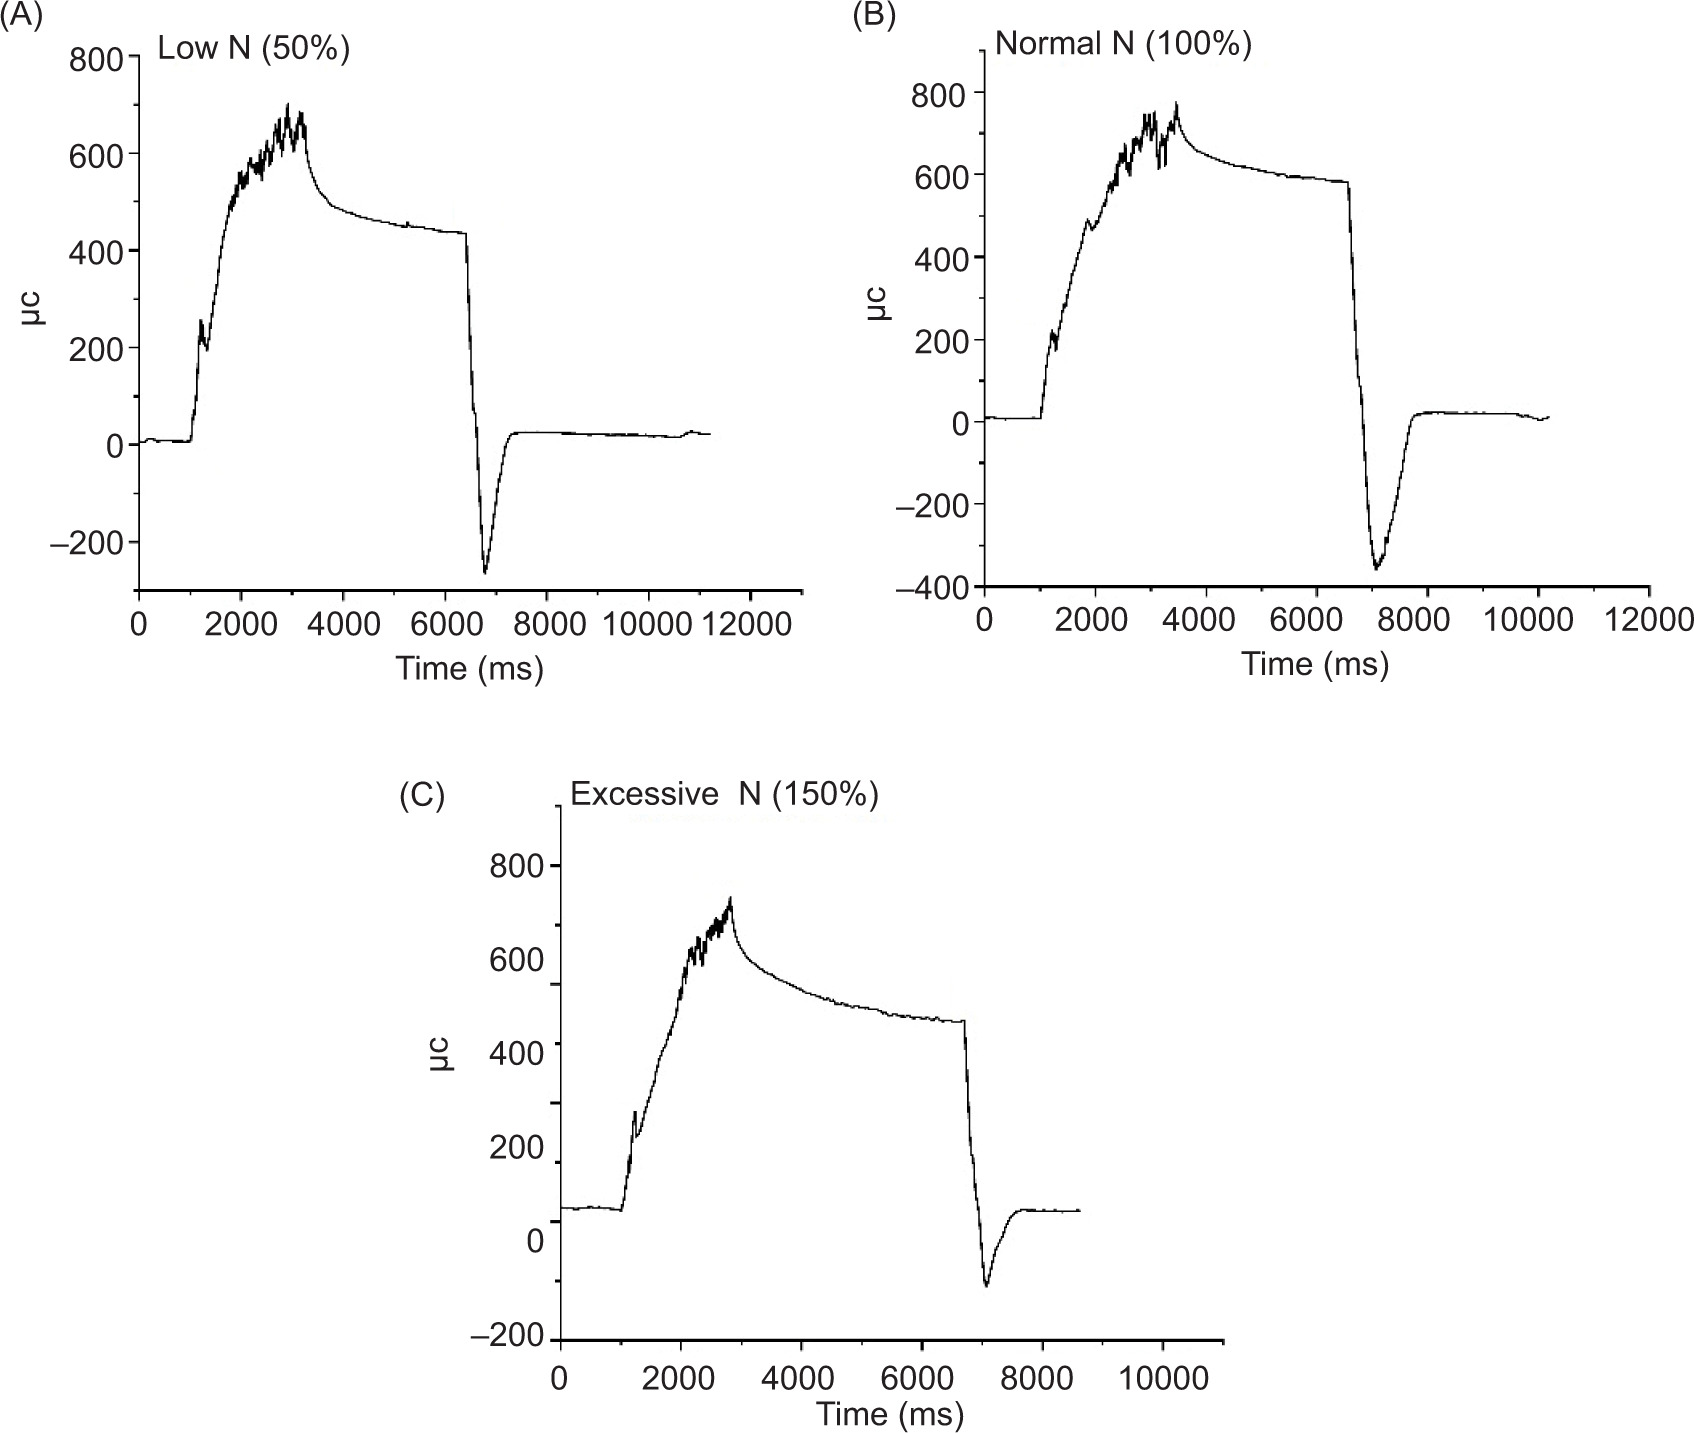
The classic strain curve of cucumber stem puncture measured by the wearable sensor is presented in Figure 12. At point A, the probe makes initial contact with the stem epidermis. Under the resistance of the epidermis, the strain on the fixed base gradually increases. Upon reaching point B, the epidermis is punctured, leading to a drop in strain. Thereafter, the probe encounters resistance from the internal stem tissue, causing the strain to rise again until the probe punctures through the opposite side of the epidermis at point C. At point D, the probe stops its operation and retracts, resulting in a rapid decrease in the base strain.
Figure 12. Strain curve of cucumber stem puncture using wearable sensors. (A) low N (50%); (B) normal N (100%) (C) excessive N (150%) treatment. The epidermal penetration event is indicated by the first strain peak (Point B), followed by an immediate strain decrease. Notably, Point B shows significant peak value variations under different nitrogen treatments (214 for normal N, 256 for low N, and 185 for excessive N), establishing it as the key reference point for nitrogen status assessment.
Point B on the strain curve represents the strain experienced by the fixed base at the moment the probe punctures the stem epidermis. A significant difference was observed in the first peak (point B) under varying N treatments. Under normal N application (100%), the peak strain at point B was 214. For low N treatment (50%), the peak value increased to 256, while excessive N application (150%) resulted in a lower peak of 185. Given the positive correlation between strain and stress on the fixed base, the stem epidermal penetration force ranked in descending order as low N > normal N > excessive N, consistent with previous findings (Liu et al., 2024). The complexity observed at the later peak (point C) is likely due to the heterogeneous distribution of internal stem tissues. The presence of vascular bundles and voids causes the resistance encountered by the probe during puncture to vary continuously. Ultimately, the initial peak at point B was selected as the key reference for N detection, and the corresponding strain was used to calculate the force on the base, thereby determining the stem epidermal penetration force (Fp).
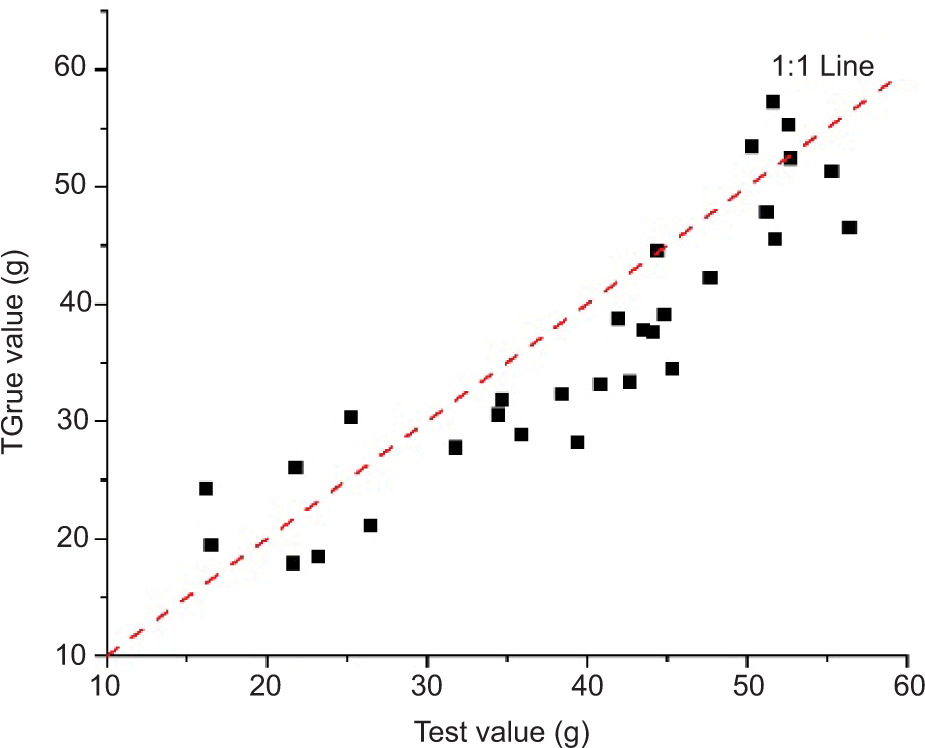
A comparative analysis was performed between the measurements from the wearable detection sensor and the true values obtained using a texture analyzer (Figure 13). The results show strong agreement between the two measurement systems, with a high coefficient of determination (R2 = 0.905) and a root mean square error (RMSE) of 12.3 g relative to the ideal 1:1 line. This demonstrates that the wearable detection sensor achieves sufficient accuracy in measuring the stem epidermal penetration force, meeting the technical requirements for N diagnosis in greenhouse cucumbers. Additionally, as presented in Table 2, the detection performance of the nitrogen diagnosis method based on stem mechanical properties is essentially comparable to that of methods relying on spectral technology.
Figure 13. Comparison between the measured values of wearable detection sensors and the true values detected by texture analyzer. Comparative analysis with the texture analyzer (standard reference method) demonstrated a strong linear correlation (R2 = 0.9046) between measurements obtained from the wearable sensor and ground-truth values, confirming the method’s sufficient accuracy for nitrogen diagnosis in greenhouse cucumber cultivation.
Table 2. A comparison between the detection method based on stem mechanical characteristics and the nitrogen detection method based on spectral technology.
| Test method | R2 | |
|---|---|---|
| Wearable sensors based on stem mechanical characteristics the nitrogen detection method based on spectral technology (Sabzi et al., 2021) | 0.9046 | |
| ANN-PSO | 0.882~0.926 | |
| PLSR | 0.951~0.986 | |
| CNN | 0.933~0.970 |
Diagnostic effect of wearable detection sensor on N nutrition in cucumber
To verify the diagnostic efficacy of the wearable detection sensor for cucumber N nutrition, the sensor was used to puncture cucumber stems subjected to different N treatments. The experimental design included three biological replicates per treatment, with five penetration measurements taken per plant. The sensor showed a maximum relative error of 22.8%, a minimum relative error of 1.2%, and an average relative error of 11.2% in detecting nitrogen nutrition in cucumbers. Within the N application range of 50% to 150%, the average relative error decreased to 6.5%. However, under more extreme stress levels, specifically at 25% and 175% N application, the average relative error increased substantially to 22.9%. These results indicate that while the sensor’s measurement accuracy diminishes under severe nitrogen deficiency or excess, it maintains reliable and accurate detection within the moderate nitrogen application range of 50% to 150%.
Impact of Wearable Sensors on Greenhouse Cucumbers
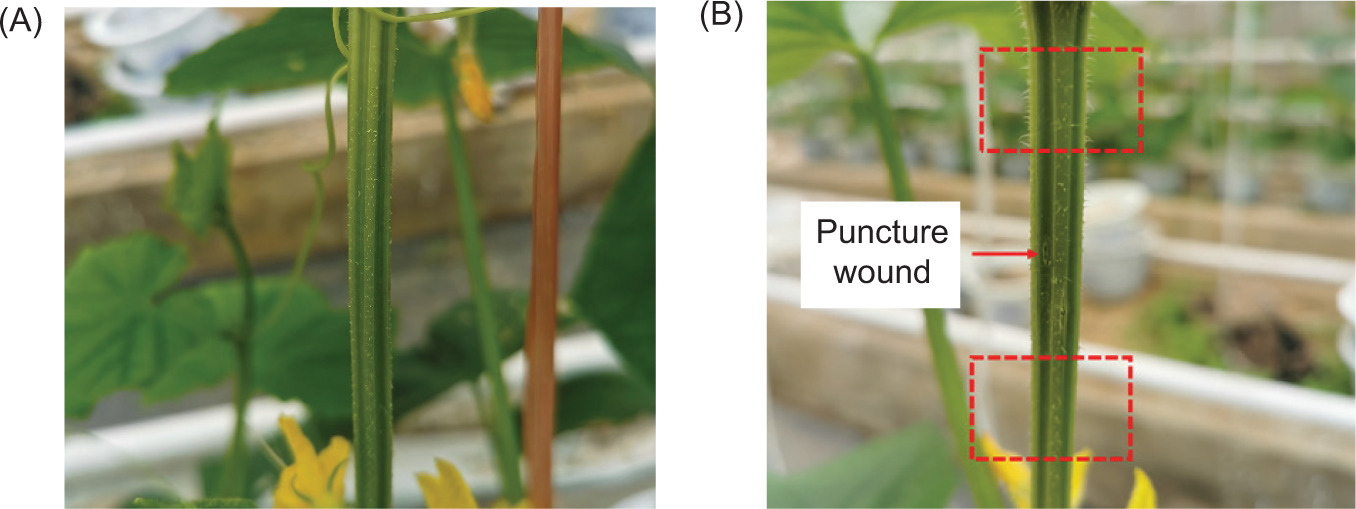
The impact of wearable detection sensors on cucumber stem epidermis after 17 days of installation is shown in Figure 14. Observations indicate that the puncture wounds on stems with the sensors had healed, and there was no noticeable difference in epidermis color compared to cucumbers without sensors installed.
Figure 14. Effects of wearable sensors on cucumber stem epidermis in greenhouse. (A) Stem without wearable sensors installed; (B) Stem after 17 days of installation.
The impact of wearable detection sensors on cucumber growth parameters after 17 days of installation is presented in Table 4. Following sensor installation, the stem diameter, leaf area, and plant height of cucumbers measured 5.59 mm, 4393.08 cm2, and 159.1 cm, respectively. Compared to cucumbers without the sensor, these values decreased by 4.89% (P = 0.638), 6.19% (P = 0.519), and 2.69% (P = 0.404), respectively. These results indicate that the sensor’s effect on cucumber growth was relatively minor and not statistically significant.
Table 3. Detection effect of wearable mechanical sensor on N nutrition of cucumber.
| N application level | Fp/gmean (SD) | Detection value | Relative error/% |
|---|---|---|---|
| 25% | 46.5 (0.13) | 19.29% | –22.8 |
| 50% | 41.8 (0.81) | 59.31% | 20.3 |
| 75% | 40.3 (0.60) | 72.85% | –2.9 |
| 100% | 36.5 (0.74) | 105.30% | 5.3 |
| 125% | 34.4 (1.10) | 123.51% | –1.2 |
| 150% | 30.8 (2.11) | 154.63% | 3.1 |
| 175% | 23.8 (7.01) | 215.19% | 23 |
Note: The average relative error is the average absolute value of the detection error at each N application level, calculated as 11.2%.
Table 4. Effects of wearable sensors on greenhouse cucumbers growth.
| Parameters | Cucumber without wearable sensor installed | Cucumber with wearable sensor installed | P-value | Effect size | Confidence interval (95%) |
|---|---|---|---|---|---|
| Stem diameter (mm) | 5.87±0.73a | 5.59±0.48a | 0.638 | 0.122 | [5.36, 6.10] |
| Leaf area (cm2) | 4683.04±384.31a | 4393.08±187.63a | 0.519 | 0.296 | [4231.78, 4844.34] |
| Plant height (cm) | 163.4±13.9a | 159.1±9.4a | 0.404 | 0.061 | [150.94, 171.46] |
The stem functions as the exclusive channel for material transport and information transmission between roots and leaves, while also providing structural support to maintain the plant’s upright posture. Additionally, the stem epidermis acts as a mechanical barrier, reducing the likelihood of bacterial invasion (Li et al., 2010). To some extent, the mechanical characteristics of stems reflect the crop’s ability to remain upright and resist external threats. Therefore, the shear mechanical properties of cucumber stems at the sensor-wearing position were measured and compared with those of stems without the wearable sensor. Five cucumber plants were selected for each treatment, and three tests were performed on each plant.
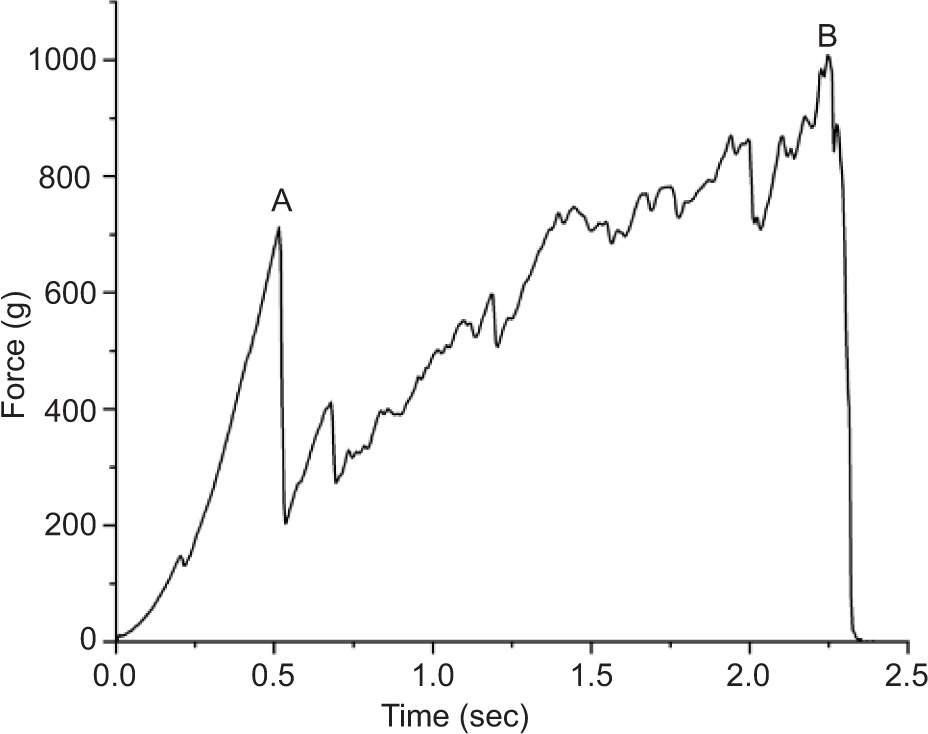
The internodes at the wearable sensor installation site on the cucumber stem were excised, and their shear mechanical properties were measured. The shear force–time curve during the cucumber stem shearing process is presented in Figure 15. In this figure, peak A corresponds to the epidermal shear force of the stem, while peak B indicates the maximum shear force of the stem.
Figure 15. Stem shear force curve.
The impact of wearable sensors on the mechanical characteristics of greenhouse cucumber stems is summarized in Table 5. After 17 days of sensor installation, the maximum shear force of stems decreased by 10.66% (P = 0.436), while the epidermal shear force increased by 11.43% (P = 0.359) compared to untreated plants. These changes were not statistically significant, indicating that the sensor had minimal physiological impact on stem integrity. The mechanical barrier provided by the stem epidermis remained intact, maintaining strong resistance to bacterial invasion. Furthermore, the lack of significant reduction in maximum shear force suggests that cellular development and tissue organization were not disrupted, allowing normal physiological functions related to material transport and information transmission to continue.
Table 5. Effects of wearable sensors on mechanical characteristics of fixed parts of stem.
| Parameters | Cucumber without wearable sensor installed | Cucumber with wearable sensor installed | P-value | Effect size | Confidence interval (95%) |
|---|---|---|---|---|---|
| Epidermal shear force (g) | 566.8±166.9a | 631.6±152.9a | 0.359 | 0.080 | [514.83, 670.63] |
| Maximum shear force (g) | 1123.9±204.9a | 1004.1±173.2a | 0.436 | 0.095 | [919.27, 1232.71] |
Discussion
Under MK treatment, a positive correlation was observed between the epidermal break distance of cucumber stems and N application, primarily due to the influence of structural carbohydrate content and cell wall integrity; as N application increased, decreases in cellulose and lignin reduced cell wall compactness, resulting in greater epidermal break distance (Xue et al., 2016). Conversely, under LK treatment, water loss led to enlarged cell gaps and weakened cell wall connections, forming a folded epidermal structure with thinner wrinkles and diminished impact resistance, thereby decreasing the epidermal break distance. Under HK treatment, excessive potassium inhibited cell wall formation and caused cell expansion through water absorption (Okazaki et al., 2020; Zhou et al., 2013), which compressed cell gaps, promoted tighter cell arrangement, and smoothed the surface; however, the reduced structural carbohydrate content thinned the cell wall and hindered structural formation, also leading to a decreased epidermal break distance. These findings are supported by recent observations of stem epidermal surface roughness (Liu et al., 2024).
Compared with the N detection model based on stem epidermal penetration, models based on stem penetration and epidermal break distance showed significantly lower R2 values. The stem epidermal break distance’s response to N application under LK and HK treatments was mainly influenced by cell osmotic pressure balance and intercellular space, with sensitivity strongly affected by crop K+ transport regulation, which could reduce detection accuracy. The stem penetration model exhibited notably lower R2 under HK treatment compared to epidermal penetration and required penetrating the entire stem, causing greater crop damage. In contrast, the epidermal penetration-based model only punctured the epidermis, minimizing crop injury and enabling rapid wound healing, thus facilitating easier repeated measurements. Therefore, the N detection model based on stem epidermal penetration was ultimately selected.
Previous studies have shown that nitrogen application levels significantly influence the formation and transport of photosynthetic products, with cellulose and lignin—especially cellulose—playing a key role in developing stem mechanical structures. Subsequent research confirmed that under low-nitrogen stress, stem puncture strength increases by at least 10%, while high-nitrogen stress causes a decrease of at least 7%, indicating that stem mechanical properties effectively reflect crop nitrogen nutrition. Furthermore, cucumber stems can recover approximately 74% of puncture wounds within 25 hours and almost completely heal within 48 hours, demonstrating that puncture-based nutritional studies do not adversely affect normal growth. Building on this, the current study developed a nitrogen detection model based on stem epidermal penetration force and designed a wearable detection device. Results revealed that under normal to mild N stress (50% to 150% application), the sensor’s detection error remained relatively low, but errors increased under severe stress conditions. This is likely because crops under normal nutrient supply maintain orderly physiological functions and uniform stem composition, whereas under nutritional stress, crops dynamically adjust photosynthate distribution based on external conditions (Gao et al., 2015; Ismail et al., 1994), leading to uneven tissue composition and structure that affect epidermal penetration force depending on puncture location. Moreover, the “ineffective cycling” of K+, a non-metabolized signal ion crucial for conveying potassium demand (Dreyer et al., 2017; Ismail et al., 1994), actively regulates osmotic balance and the activity of glucose metabolism and transport enzymes (Dreyer et al., 2017; Sun et al., 2021; Zhang et al., 2021). These dynamic K+ changes further contribute to uneven tissue formation under nutritional stress, explaining the significant detection errors observed with wearable sensors during severe N deficiency or excess.
Previous studies indicate that non-contact nitrogen monitoring methods—such as optical and remote sensing technologies—have been widely used due to their advantages in being non-destructive, rapid, and suitable for high-throughput analysis. However, these methods are often vulnerable to environmental interference. In contrast, wearable sensing technology offers enhanced temporal and spatial resolution, with flexible sensors gaining attention in crop phenotyping because of their excellent mechanical properties and biocompatibility. Recently, flexible electrochemical and optical sensors have made notable advances in monitoring individual plant growth, leaf moisture, and transpiration. Nonetheless, substantial progress in detecting key macronutrients like nitrogen remains limited (YAN et al., 2024). The nitrogen sensor developed in this study, leveraging stem mechanical characteristics, addresses this gap and opens new avenues for multi-target detection using flexible sensors. For example, functionalizing the probe surface with composite materials could enable electrochemical sensor fabrication, potentially improving performance under extreme nitrogen conditions (e.g., 25% or 175% N) and expanding applicability across a broader range of crops.
Nitrogen is a vital component of proteins and chlorophyll, essential for crop growth and improving fruit quality. Developing accurate nitrogen prediction methods and sensor technologies holds great promise for enhancing fertilizer use efficiency, lowering production costs, and reducing environmental damage from excessive nitrogen application. Modern agricultural research highlights the use of advanced analytical instruments for detailed plant physio-biochemical profiling as a key driver of phenomics progress. Alongside this, studying stem biomechanical properties under stress conditions provides valuable phenotypic data. Together, these approaches deepen our understanding of the biological mechanisms shaping traits and advance crop life science by elucidating genotype-phenotype-environment interactions within the framework of big-data-driven agriculture.
Conclusions
The positive response of stem mechanical characteristics to N application established a strong basis for using these traits to detect crop health. Compared to N detection models based on stem penetration and epidermal break distance, the model utilizing stem epidermal penetration showed significantly higher R2 values, indicating superior accuracy. It was also less susceptible to interference and caused less damage to crops. Consequently, a N detection model based on stem epidermal penetration was developed, demonstrating robust performance with R2 and RMSE values of 0.8676 and 45.1% (LK treatment), 0.9398 and 34.9% (MK treatment), and 0.9190 and 38.12% (HK treatment), respectively. The wearable detection sensor for N nutrition was created by integrating this model with a 3D-printed fixed skeleton and a micro motor. The sensor effectively detected nitrogen status in greenhouse cucumbers, accurately diagnosing nitrogen nutrition while exerting minimal impact on plant growth and exhibiting excellent biocompatibility.
Data Availability Statement
The datasets used or analyzed during the current study are available from the corresponding author [Q.S.] on reasonable request.
Author Contributions
Conceptualization, Y.L. and H.M.; methodology, Y.L. and Q.S.; software, Y.L. and M.X.; validation, Y.L., B.W. and Q.S.; formal analysis, Y.L. and Q.S.; investigation, Y.L. and Q.S.; resources, Y.L. and Q.S.; data curation, Y.L. and Q.S.; writing—original draft preparation, Y.L., Y.Y., M.X. and Q.S.; writing—review and editing, Y.L., Q.S., Y.W., B.W., Y.Y., W.Q. and H.M.; visualization, Y.L.; supervision, Y.L. and Q.S.; project administration, Y.L., Y.W., W.Q. and B.W.; funding acquisition, Q.S. and H.M. All authors have read and agreed to the published version of the manuscript.
Conflicts of Interest
The authors declare no conflict of interest.
Funding
This research was financially supported by the National Natural Science Foundation of China (Nos. 32201686), the General Project of Basic Science (Natural Science) Research in Higher Education Institutions in Jiangsu Province (1020241831), the Open Project of the Key Laboratory of Intelligent Agricultural Technology Integration and Application Innovation, Ministry of Agriculture and Rural Affairs (KF2505), the Special Funding of the Suzhou Polytechnic Institute of Agriculture Innovative Research Team (No. CXTD202403); and the PhD Faculty Special Program at Suzhou Polytechnic Institute of Agriculture.
REFERENCES
Camps, C., Guillermin, P., Mauget, J. C., & Bertrand, D. (2005). Data analysis of penetrometric force/displacement curves for the characterization of whole apple fruits. Journal of Texture Studies, 36(4), 387–401. 10.1111/j.1745-4603.2005.00023.x
Chai, Y. F., Chen, C. Y., Luo, X., Zhan, S. J., Kim, J., Luo, J. K., . . . Liu, X. J. (2021). Cohabiting Plant-Wearable Sensor In Situ Monitors Water Transport in Plant. Advanced Science, 8(10). 10.1002/advs.202003642
Chen, R. P., Ren, S. Y., Li, S., Han, D. P., Qin, K., Jia, X. X., . . . Gao, Z. X. (2023). Recent advances and prospects in wearable plant sensors. Reviews in Environmental Science and Bio-Technology, 36. 10.1007/s11157-023-09667-y
Diacci, C., Abedi, T., Lee, J. W., Gabrielsson, E. O., Berggren, M., Simon, D. T., . . . Stavrinidou, E. (2021). Diurnal in vivo xylem sap glucose and sucrose monitoring using implantable organic electrochemical transistor sensors. Iscience, 24(1), 101966. 10.1016/j.isci.2020.101966
Dreyer, I., Gomez-Porras, J. L., & Riedelsberger, J. (2017). The potassium battery: a mobile energy source for transport processes in plant vascular tissues. New Phytologist, 216(4), 1049–1053. 10.1111/nph.14667
Gao, K., Chen, F. J., Yuan, L. X., Zhang, F. S., & Mi, G. H. (2015). A comprehensive analysis of root morphological changes and nitrogen allocation in maize in response to low nitrogen stress. Plant Cell and Environment, 38(4), 740–750. 10.1111/pce.12439
Gao, L., Wu, M. G., Yu, X. E., & Yu, J. S. (2024). Device design principles and bioelectronic applications for flexible organic electrochemical transistors. International Journal of Extreme Manufacturing, 6(1). 10.1088/2631-7990/acfd69
Hou, X. B., Xue, Q. W., Jessup, K. E., Zhang, Y. H., Blaser, B., Stewart, B. A., & Baltensperger, D. D. (2021). Effect of nitrogen supply on stay-green sorghum in differing post-flowering water regimes. Planta, 254(4). 10.1007/s00425-021-03712-2
Ismail, C., Christine, H., & Horst, M. (1994). Changes in phloem export of sucrose in leaves in response to phosphorus, potassium and magnesium deficiency in bean plants. Journal of Experimental Botany, 45(9), 1251–1257.
Kim, J., Kim, M., Lee, M. S., Kim, K., Ji, S., Kim, Y. T., . . . Park, J. U. (2017). Wearable smart sensor systems integrated on soft contact lenses for wireless ocular diagnostics. Nature Communications, 8, 8. 10.1038/ncomms14997
Kim, J. J., Allison, L. K., & Andrew, T. L. (2019). Vapor-printed polymer electrodes for long-term, on-demand health monitoring. Science Advances, 5(3), 9. 10.1126/sciadv.aaw0463
Li, W. J., He, P., & Jin, J. Y. (2010). Effect of Potassium on Ultrastructure of Maize Stalk Pith and Young Root and Their Relation to Stalk Rot Resistance. Agricultural Sciences in China, 9(10), 1467–1474. 10.1016/s1671-2927(09)60239-x
Liu, Y., Wang, Y., Ma, G., Wang, B., Du, X., Shi, Q., . . . Mao, H. (2022). Mechanical properties of stem and physiological–biochemical responses of cucumber under different N and K conditions. Quality Assurance and Safety of Crops & Foods, 14(1), 64–74. 10.15586/qas.v14i1.1035
Liu, Y., Wang, Y., Wang, B., Shi, Q., & Mao, H. (2024). Preliminary study on the diagnosis of NK stress based on the puncture mechanical characteristics of cucumber stem. BMC Plant Biol, 24(26).
Okazaki, K., Tanahashi, T., Kato, Y., Suzuki, I., Tanaka, F., & Ohwaki, Y. (2020). Metabolic indices related to leaf marginal necrosis associated with potassium deficiency in tomato using GC/MS metabolite profiling. Journal of Bioscience and Bioengineering, 130(5), 520–524. 10.1016/j.jbiosc.2020.06.007
Sabzi, S., Pourdarbani, R., Rohban, M. H., Garcia-Mateos, G., & Arribas, J. I. (2021). Estimation of nitrogen content in cucumber plant (Cucumis sativus L.) leaves using hyperspectral imaging data with neural network and partial least squares regressions. Chemometrics and Intelligent Laboratory Systems, 217, 14. 10.1016/j.chemolab.2021.104404
Sevanthi, A. M., Sinha, S. K., V, S., Rani, M., Saini, M. R., Kumari, S., . . . Mandal, P. K. (2021). Integration of Dual Stress Transcriptomes and Major QTLs from a Pair of Genotypes Contrasting for Drought and Chronic Nitrogen Starvation Identifies Key Stress Responsive Genes in Rice. Rice (N Y), 14(1). 10.1186/s12284-021-00487-8
Sun, Y. M., Huang, X. L., Zhang, T., Yang, Y. H., Cheng, X. F., Xu, X. Y., & Yuan, H. Y. (2021). Potassium deficiency inhibits steviol glycosides synthesis by limiting leaf sugar metabolism in stevia (Stevia rebaudiana Bertoni) plants. Journal of Integrative Agriculture, 20(11), 2932–2943. 10.1016/s2095-3119(20)63472-4
Tang, W. Z., Yan, T. T., Wang, F., Yang, J. X., Wu, J., Wang, J. L., . . . Li, Z. H. (2019). Rapid fabrication of wearable carbon nanotube/graphite strain sensor for real-time monitoring of plant growth. Carbon, 147, 295–302. 10.1016/j.carbon.2019.03.002
Wang, Y. F., Ma, G. X., Du, X. X., Liu, Y., Wang, B., Xu, G. L., & Mao, H. P. (2020). Effects of Nutrient Solution Irrigation Quantity and Downy Mildew Infection on Growth and Physiological Traits of Greenhouse Cucumber. Agronomy-Basel, 10(12). 10.3390/agronomy10121921
Xue, J., Zhao, Y. S., Gou, L., Shi, Z. G., Yao, M. N., & Zhang, W. F. (2016). How High Plant Density of Maize Affects Basal Internode Development and Strength Formation. Crop Science, 56(6), 3295–3306. 10.2135/cropsci2016.04.0243
Yan, B. P., Zhang, F., Wang, M. Y., Zhang, Y. K., & Fu, S. L. (2024). Flexible wearable sensors for crop monitoring: a review. Frontiers in Plant Science, 15, 17. 10.3389/fpls.2024.1406074
Zhang, J. L., Lu, Z. F., Ren, T., Cong, R. H., Lu, J. W., & Li, X. K. (2021). Metabolomic and Transcriptomic Changes Induced by Potassium Deficiency During Sarocladium oryzae Infection Reveal Insights into Rice Sheath Rot Disease Resistance. Rice, 14(1). 10.1186/s12284-021-00524-6
Zhou, L. Q., Liu, X. C., Chen, Y. J., Yan, Z. J., & Chen, Q. (2013). Formula Selection and Application of Water-soluble Fertilizer For Cherry in Beijing Suburb. Heilongjiang Agricultural Sciences, 2, 34–38.
Appendix A
Figure A1. Shows the wearable device and motor. The motor is a dedicated lifting motor for the Redmi K30 Pro (A) Design diagram; (B) The motor. The motor had a mass of 3.5 g, a diameter of 3 mm, a length and width of 28 mm and 15 mm. The puncture probe had a diameter of 0.7 mm and was fixed on a slider with a running range of 0-9 mm.
Figure A2. Shear test of stem on the 7th day of installation.
Table A1. Nomenclature.
| b | Width of the test piece, m |
| CK | 100% N + 100% K |
| Ep | Elastic modulus of the base material |
| Ep | Epidermal penetration |
| Fp | Force exerted on the test piece, which is numerically equal to the epidermal penetration force, N |
| h | Thickness of the test piece, m |
| HK | High K, 150% |
| HN | High N,150%n |
| HNLK | 150% N + 50% K |
| k | Influencing factors of K+ |
| K | Potassium |
| L | Distance from the point of force application to the measuring point of the strain gauge, m |
| LK | Low K, 50% |
| LN | Discrete element method |
| LNLK | 50% N + 50% K |
| LNHK | 50% N + 150% K |
| MK | Medium K, 100% |
| Mp | Bending moment, N•m |
| N | Nitrogen |
| N | Level of N application, % |
| R2 | Coefficient of determination |
| RMSE | Root mean square error |
| W | Bending section coefficient, m4 |
| εp | Strain of strain gauge |
| η | Intercept of the model |
| σp | Stress of the tested piece, Pa |
| τ | Slope of the model |