
Download

D x j = ∑ r = 1 R ∑ y = 1 y r w r ∑ r = 1 R w r r y i r x y β x S j r 1 i r x y = 1 − d x y d r , max 2 i r x y = exp − 2.99 d r , max d x y 3 Q x j = H j = 1 − D x y z D x y z + k 2 4


RESEARCH ARTICLE
Impact of watershed habitat quality based on land use: a case study of taking Ciyao River Basin
Hui Xiao-Mei, Yuan Jin*, Li Chao, Fan Xiao-Jun, Zhou Yuan
College of Environmental Science and Engineering, Taiyuan University of Technology, Jinzhong, China
Abstract
Land use pattern is one of the most important factors affecting the quality of habitats, which is taken as the research objective in this study. Based on the land use data of Ciyao river basin from 1985 to 2020, transfer matrix analysis, superposition analysis, and zoning statistics were carried out by ArcGIS. The impact of main threat sources (cultivated land, urban land, and rural residential land) on water quality was calculated using the investment model. The habitat changes and the impact of the habitat quality of the basin on the hydrological and water quality were analyzed. The findings demonstrated that the land-type conversion in Ciyao River Basin from 1985 to 2020 is mainly manifested in the conversion from cultivated land to construction land (94.49 km2), and from grassland to cultivated land (21.59 km2) and forest land (27.15 km2). The habitat quality of the Ciyao River Basin decreased gradually from North to South. The medium and high habitat quality areas are mainly concentrated in the headwater area of the river. Due to the change in land type, the habitat quality in the headwater area of the river significantly improved from 2005 to 2020, while the habitat quality in the confluence area of the Wuliang section significantly declined from 1995 to 2015. Due to the improvements of habitat quality in the source area of the river and water conservation capacity, the total amount of water resources and annual runoff depth of Ciyao River significantly increased from 2005 to 2019 without significant changes in precipitation. The water quality of the Ciyao River has improved due to development of environmental pollution control and the improvement of watershed habitat in 2016–2020.
Key words: Ciyao River, habitat quality, InVEST model, land use
*Corresponding author: Yuan Jin, College of Environmental Science and Engineering, Taiyuan University of Technology, Jinzhong 030600, China. Email: [email protected]
Received: 1 October 2022; Accepted: 19 November 2022; Published: 1 January 2023
© 2023 Codon Publications
This is an Open Access article distributed under the terms of the Creative Commons Attribution-NonCommercial-ShareAlike 4.0 International (CC BY-NC-SA 4.0). License (http://creativecommons.org/licenses/by-nc-sa/4.0/)
Introduction
Environmental pollution has become a global concern in the last two decades (Bai et al., 2022; Chen et al., 2022; Peng et al., 2021; Tian et al., 2021; Wan et al., 2022; Xu et al., 2021; Yang et al., 2021; Yin et al., 2022; Zhang et al., 2022a; Zhao et al., 2021, 2022). Chemical pollution caused by wastewater discharge (Ge et al., 2019; Lin et al., 2021; Tan et al., 2022a, 2022b) and solid waste (Wang et al., 2022) and ambient air (Liu et al., 2022; Wu et al., 2021; Yin et al., 2021, 2022) can pose harmful effects on the quality of water resources.
The ecological environment is the natural basis for human life and social development (Wang et al., 2008). Habitat quality is defined as the ability of an ecosystem to provide conditions suitable for the sustainable development and survival of individuals and populations in a certain time and space (Bao et al., 2015; Berta Aneseyee et al., 2020; Zhang et al., 2019b). It can usually be quantitatively characterized by habitat quality indexes (Aiguo et al., 2020; Wilson et al., 2016). Land use is one of the foremost factors affecting habitat quality (Shengkai et al., 2022; Sushi, 2020; Quan et al., 2021). Changes in land will influence the composition and structure of the habitat and cause matter circulation and energy flow between habitat patches, which eventually lead to changes in the habitat quality (Fang et al., 2021; Terrado et al., 2016; Sala et al., 2000; Zhang et al., 2021). Habitat quality assessment is a complicated process. It is significantly advantageous to use models for evaluating habitat quality (Chen et al., 2016; Ng et al., 2011).
The common models for habitat quality evaluation include A.R.I.E.S (Bagstad et al., 2011; Villa et al., 2009), MIMES (Boumans and Costanza, 2007; Boumans et al., 2015; Wanghe et al., 2022), and InVEST (Chen et al., 2021; Liu et al., 2020; Redhead et al., 2016, 2018). InVEST models offer some advantages such as low application costs, high accuracy, ease of operation, convenient data access, and powerful space visualization, which allows them to be widely used (Li et al., 2021). Yaqian et al. (2020) analyzed the changes in habitat quality in Tang County, Hebei Province, using the Habitat Quality module in the InVEST model to provide a scientific basis for reasonable land planning and the protection of habitat and biodiversity in the land development work. Wang et al. (2020) assessed the spatiotemporal patterns for habitat quality in the Nen River Basin from 1980 to 2015 and gave rational suggestions for the protection of its ecological environment.
Rivers are closely related to human culture, and watershed habitat quality directly impacts the aqueous environment of rivers (Dai et al., 2022; Gao et al., 2021; Li et al., 2022). Problems such as overexploitation of water resources, excessively heavy pollution, and degraded ecosystem exist in the rivers in the northern part of China. The aqueous environment in rivers has been significantly improved with the implementation of the Action Plan for Prevention and Control of Water Pollution (Nan et al., 2017).
As the primary tributary of the Fen River, the Ciyao River is seasonal, in the basin of which economic and social developments exert great pressure on the ecological environment of the stream, resulting in problems such as water resource shortage, aquatic environment pollution, and aquatic ecosystem degradation. Water pollution control was carried out under public supervision in the Ciyao River in Shanxi province, with typical characteristics of rivers in the northern region, so research on it is extensively instructive (Ding et al., 2020).
In this study, the changes in land-use type and habitat quality response in the Ciyao River Basin during the period 1985–2020 were analyzed using tools such as ArcGIS and InVEST models to explore the impact of watershed habitat quality on the hydrology and water quality of the streams, in a hope of providing technical support for future pollution prevention and control and ecological protection of the Ciyao River and the rives in the northern region.
Materials and Methods
Research region
Originating from Taling Village in the mountainous area of Jiaocheng County, the Ciyao River runs across Qingxu, Jiaocheng, Wenshui, Fenyang, Pingyao, Xiaoyi, and Jiexiu before flowing into the Fen River on the right bank in the middle reach of the River Fen, with a total length of its main stem of 86.4 km and a total drainage area of 1059.83 km2. Its main tributaries are Hupingshi, Wayao, and Baishinan rivers. The Baishinan River starts from the Baishi Mountains in Qingxu County and drains 241.26 km2, with U-shaped channels and stable riverbeds. Moreover, the Wayao River, the headwaters of which are on the Huye Mountains in the north of Jiaocheng County, enters the Ciyao River in the south of western Shihou Village, with a total area of 105.94 km2 (Yingming, 2004).
The Ciyao River Basin is long and narrow, stretching from mountains to plains, with the terrain being high in the north and low in the south. It is fragmented by gullies and ravines, with poor vegetation coverage and exposed and heavily weathered rocks. The confluence takes a long time, and the runoff process is steady. Due to continental monsoon climate and blockage by mountain ranges, it is difficult for the monsoon to enter and thus causes less precipitation, with an annual average rainfall of 455 mm and the months from June to September receiving the highest rainfall, which accounts for 70% of the rainfall of the entire year.
During the 13th Five-Year Plan For Economic And Social Development Of The People’s Republic Of China, one state-controlled section (Sangliushu) was created in the Ciyao River Basin, and to enhance the protection of the water environment of the river, three automated water quality monitoring stations (Meijinqiao, Wuliang, Peihui) were also established. In order to better analyze and evaluate the watershed habitat quality and its influence on the river, the Ciyao River Basin is divided into four regions according to the types of land and the distribution of automated monitoring stations. They are the river source area (Lingdi Village acts as the representative section of river water quality), Wuliang section confluence area, Peihui section confluence area, and Sangliushu section confluence area. The scope and zones of the Ciyao River Basin are shown in Figure 1.
Figure 1. Overview of Ciyao River Basin.
Data sources and analytical methods
The data on land use in the Ciyao River Basin were obtained by interpreting the satellite remote sensing image data (30 m resolution) of the geospatial data cloud platform, and this included six types of land uses: forest land, bush, agricultural land, grassland, water body, and construction land uses. Statistics of areas and analysis of various categories of land use were done using ArcGIS, and changes in the types of land use in the Ciyao River Basin during different years were analyzed using the transfer matrix.
Hydrological data of rivers and streams were derived from the water resource bulletin of Lvliang city. Subject to data collection, the hydrological data of 2005–2019 was used in this study. The data on water quality in rivers and streams originated from the automated water quality monitoring stations and onsite sampling and testing results. The data from the automated monitoring station were for the period 2016–2020.
Methods for evaluating habitat quality
Model principles Habitat quality modules in the InVEST model evaluates habitat quality and degradation in different land use patterns by defining external threat sources affecting habitat in combination with the sensitivity of land use types and the intensity of external threats. Model algorithms use grid as the basic evaluation unit, assigning each grid a land use type. By taking into account factors such as the influence distance and spatial weight of the factor, the habitat degradation index (Dxj) of each grid is calculated to obtain the habitat quality index (Qxj).
The formula for calculating the habitat degradation index (Dxj) (Zhang et al., 2019a, 2020) is as follows:
Linear regression
Exponential regression
Dxj is the degree of habitat degradation with a scale of 0–1. The bigger the value, the worse the habitat degradation (Zhang et al., 2019a, 2022b). From the above equations,
-
R is the number of threat factors;
-
wr is the weight of threat factor r;
-
Yr is the number of grids for the threat factor layer in the land use type diagram;
-
ry is the number of threat factors in grid y in the land use type diagram;
-
Sjr is the sensitivity of threat factor r to type j land cover;
-
dxy is the distance between grid x (habitat) and grid y (threat factor);
-
dr, max is the influence range of threat factor r;
-
βx is the anti-interference level of habitat;
-
irxy is the influence of threat factor r in grid y on grid x.
The formula for calculating the habitat quality is as follows (Zhang et al., 2019a, 2022b):
Where, Qxj is the habitat quality index, with a scale of 0–1; the bigger the value, the higher the habitat suitability. In the above Equation (4),
-
Hj is habitat suitability;
-
k is the half-saturation coefficient, which is usually half of the maximum degradation;
-
Z is the default parameter of the model.
Based on previous investigations and analyses, it was revealed that human activity is highest in agricultural and construction lands in the Ciyao River Basin, and the urban and rural residential lands account for a big proportion of the construction land. Therefore, agricultural land, urban land, and rural settlements were identified as the ecological threat factors of changes in habitat quality in the Ciyao River Basin. The weights and influence distance of threat factors were set by referencing the existing researches, as shown in Table 1. The sensitivity of various land use types to threat factors is shown in Table 2, and the half-saturation parameter k was set as 0.5.
Table 1. Influence range and weight of threat factors.
| Threat factor | Maximum influence distance/km | Weights | Regression types |
|---|---|---|---|
| Agricultural land | 1 | 0.6 | Linear |
| Urban land | 7 | 0.8 | Exponential |
| Rural settlements | 3 | 0.4 | Exponential |
Table 2. Sensitivity of different land use types to ecological threat factors.
| Land use types | Habitat suitability | Sensitivity to ecological threat factor | ||
|---|---|---|---|---|
| Agricultural land | Urban land | Rural settlements | ||
| Agricultural land | 0.5 | 0.3 | 0.8 | 0.6 |
| Forest land | 1 | 0.6 | 0.9 | 0.8 |
| Bush | 1 | 0.5 | 0.8 | 0.6 |
| Grassland | 0.6 | 0.3 | 0.7 | 0.7 |
| Water body | 0.8 | 0.65 | 0.7 | 0.6 |
| Urban land | 0 | 0 | 0 | 0 |
| Rural settlements | 0 | 0 | 0 | 0 |
Results and Discussion
Land use changes
The land use types of the Ciyao River Basin are mainly agricultural land, grassland, and construction land (Li et al., 2010). Agricultural land occupies the greatest share of the area, covering 575.05 km2 in 2020, accounting for 54.26% of the basin’s total area, followed by grasslands (207.97 km2) and construction land (including 189.41 km2 of impervious lands, such as urban land and rural settlements). Table 3 indicates the areas and percentages of various land use types of the Ciyao River Basin in different years. Construction and agricultural lands are the two categories that experience the most significant changes among all the land use types. The construction land area went up remarkably from 71.19 km2 in 1985 to 189.41 km2 in 2020, with its share up 11.15%, and the area of agricultural land decreased most from 691.96 km2 to 575.05 km2, with its share down 11.03%.
Table 3. Proportion of land use type area in Ciyao River Basin in different years (unit: %).
| Land use types | 1985 | 1995 | 2005 | 2010 | 2015 | 2020 | ||||||
|---|---|---|---|---|---|---|---|---|---|---|---|---|
| Area (km2) | Share (%) | Area (km2) | Share (%) | Area (km2) | Share (%) | Area (km2) | Share (%) | Area (km2) | Share (%) | Area (km2) | Share (%) | |
| Agricultural land | 691.96 | 65.29 | 667.46 | 62.98 | 607.14 | 57.29 | 580.62 | 54.78 | 574.57 | 54.21 | 575.05 | 54.26 |
| Forest land | 44.27 | 4.18 | 45.78 | 4.32 | 48.05 | 4.53 | 64.95 | 6.13 | 68.09 | 6.42 | 83.00 | 7.83 |
| Bush | 4.00 | 0.38 | 3.46 | 0.33 | 3.60 | 0.34 | 2.46 | 0.23 | 2.46 | 0.23 | 2.17 | 0.21 |
| Grassland | 247.04 | 23.31 | 249.28 | 23.52 | 265.38 | 25.04 | 250.45 | 23.63 | 234.39 | 22.12 | 207.97 | 19.62 |
| Water body | 1.37 | 0.13 | 1.79 | 0.17 | 1.01 | 0.10 | 2.24 | 0.21 | 2.25 | 0.21 | 2.23 | 0.21 |
| Construction land | 71.19 | 6.72 | 92.07 | 8.69 | 134.65 | 12.71 | 159.11 | 15.01 | 178.08 | 16.80 | 189.41 | 17.87 |
Table 4 shows the results of calculations using the transfer matrix for land use from 1985–2020. These findings reveal that the increase in construction lands mainly resulted from the conversion of agricultural lands, and the conversion area was up to 94.49 km2, which is also the main reason for the decline in the share of agricultural land area. The distribution of changes in land use types is shown in Figure 2. It can be seen that the conversion of agricultural land into construction land mainly occurred in the Wuliang section confluence area and, most significantly, along the banks of the Baishinan River. Despite an increase in the area of construction land, agricultural land was dominant in the Wuliang section confluence area during 1985–1995, and construction land exceeded agricultural land and became the land use type with the greatest share in the region.
Table 4. Land use transfer matrix of Ciyao River Basin from 1985 to 2020.
| 2020 | Agricultural land | Forest land | Bush | Grassland | Water body | Construction land |
|---|---|---|---|---|---|---|
| 1985 | ||||||
| Agricultural land | 451.37 | 3.65 | 0.04 | 18.64 | 0.99 | 94.49 |
| Forest land | 0.14 | 35.83 | 0.02 | 0.41 | 0.00 | 0.00 |
| Bush | 0.01 | 2.31 | 0.51 | 0.29 | 0.00 | 0.00 |
| Grassland | 21.59 | 27.15 | 1.08 | 153.25 | 0.00 | 3.65 |
| Water body | 0.04 | 0.00 | 0.00 | 0.00 | 0.78 | 0.27 |
| Construction land | 0.42 | 0.00 | 0.00 | 0.16 | 0.04 | 56.93 |
Figure 2. Changes of land use types in Ciyao River Basin in different years.
In addition to being converted into construction land, agricultural land was transferred to other types of lands, with a certain amount of areas, mostly into forest land and grassland, with areas of 3.65 km2 and 18.64 km2, respectively. Conversion among forest land, grassland, and agricultural land mainly occurred in the areas of rivers and stream sources in the Ciyao River Basin. The area of forest land grew contentiously (by 4.18–7.83%) during 1985–2020, and the increased areas came from primary grassland (27.15 km2) and secondarily agricultural land (3.65 km2). Changes in grassland were a special case as it showed a rising (from 23.31 to 23.52% and then to 25.04%) trend in 1985–2005 and continuously declined (from 25.04 to 22.12% and to 19.62%) in 2005–2020. Grassland and agricultural land were in a situation of mutual conversion. On the one hand, 18.64 km2 of agricultural land was converted into grassland, and on the other 21.59 km2 of grassland was converted into agricultural land.
Overall, a rule in conversion among various land use types of the Ciyao River Basin in 1985–2020 is mainly reflected in the conversion of agricultural land into construction land and the conversion of grassland into agricultural land and forest land.
Habitat quality analysis
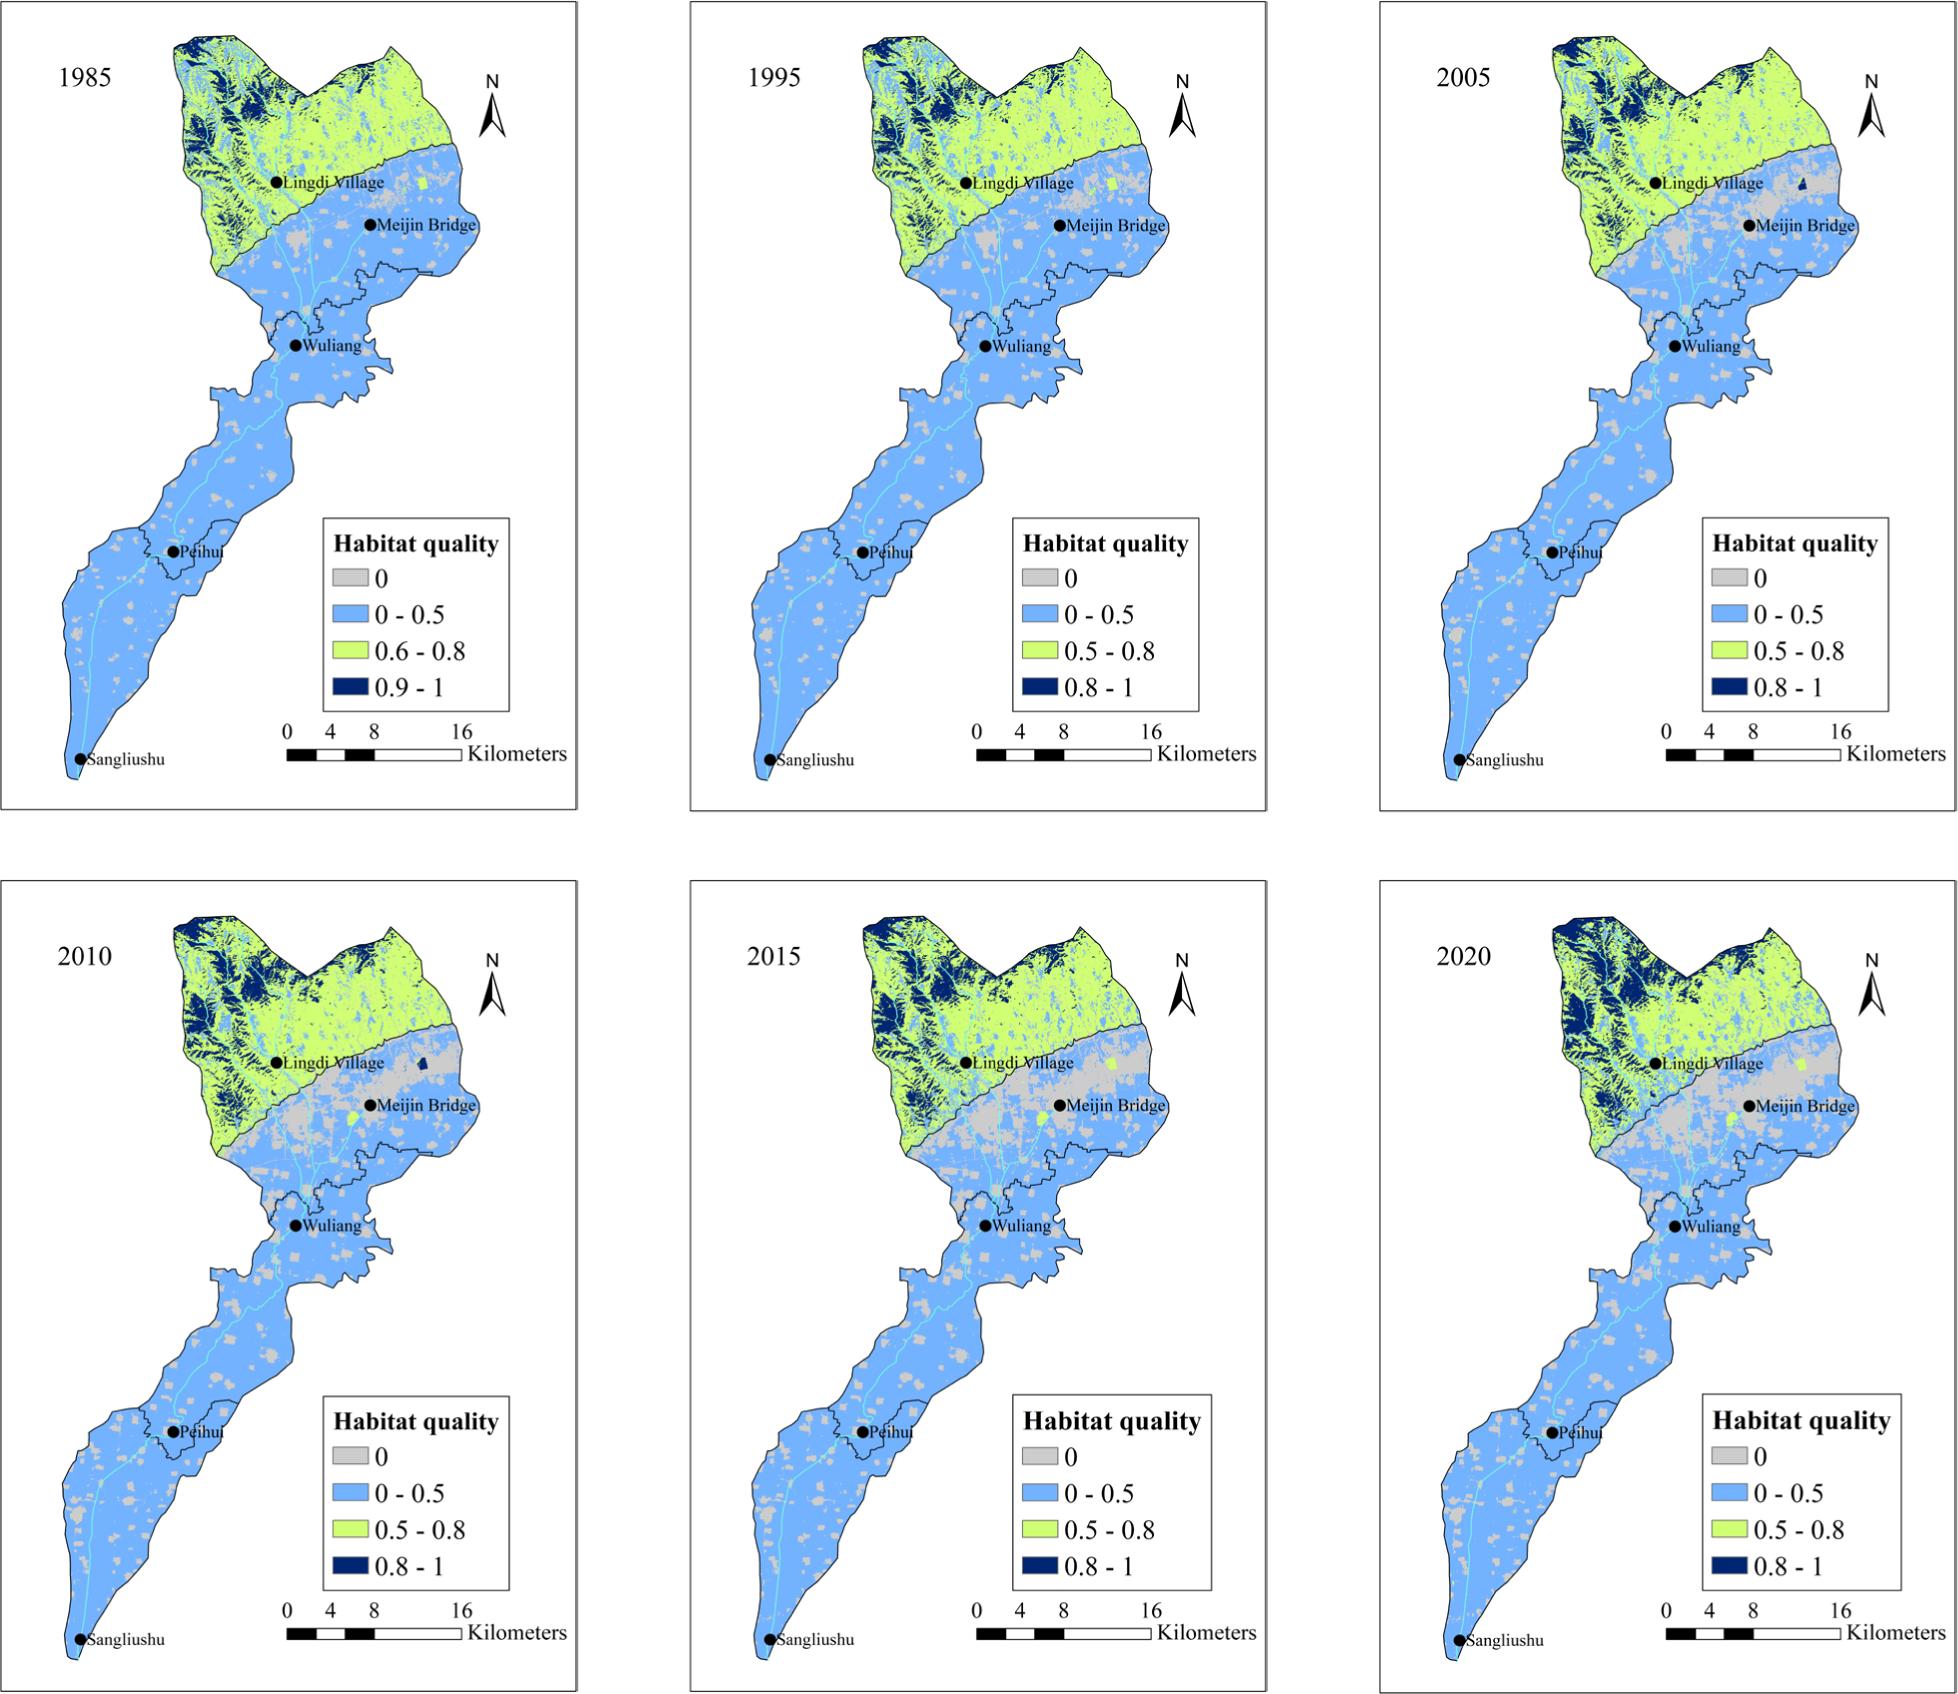
We used the InVEST model to evaluate habitat quality in the Ciyao River Basin and divided the water habitat quality into three grades using the natural breaks classification method in the ArcGIS software, that is, high (1.0 ≥ Qx j ≥ 0.8), moderate (0.8 > Qxj ≥ 0.5) and low (0.5 > Qx ≥ 0) habitat quality regions (see Table 5). The habitat quality of the Ciyao River Basin at different times is shown in Figure 3, and the percentages of areas of habitat quality of different grades are shown in Table 5.
Table 5. Change in percentage of area of Ciyao River habitat quality grade from 1985 to 2020 (unit %).
| Grading standards | 1985 | 1995 | 2005 | 2010 | 2015 | 2020 |
|---|---|---|---|---|---|---|
| High | 4.71 | 4.85 | 5.00 | 6.62 | 6.92 | 8.31 |
| Medium | 23.35 | 23.55 | 25.08 | 23.66 | 22.14 | 19.64 |
| Low | 71.94 | 71.60 | 69.92 | 69.72 | 70.94 | 72.05 |
Figure 3. Habitat quality map of Ciyao River Basin in different years.
Based on Figure 3, habitat quality in the Ciyao River Basin declined from north to south. High habitat quality regions are mainly concentrated in the forest land–dominated regions in the areas of the source of rivers and streams, with low population density and good natural ecological conditions; moderate habitat quality regions are concentrated in the grassland-dominated regions within the area of the source of rivers and streams, and low habitat quality regions are mainly distributed in Wuliang, Peihui, and Sangliushu section confluence areas, with agricultural and construction lands being dominant. According to Table 5, from 1985 to 2020, the share of high habitat quality regions in terms of areas increased from 4.71 to 8.31%; the share of moderate habitat quality regions increased first and then declined, up from 23.35% in 1985 to 25.08% in 2005 and then down to 19.64% in 2020; the share of low habitat quality regions decreased first, and then increased, down from 71.94% in 1985 to 54.71% in 2010, and then up to 72.05% in 2020. Watershed habitat qualities at different years were compared, and the changes in habitat quality are shown in Figure 4. Regions that saw improvement in habitat quality are mainly concentrated in the areas of the source of rivers and streams, which is most remarkable, especially during the periods 2005–2010, 2010–2015, and 2015-2020. The main reason for this is that a substantial amount of agricultural land was converted into forest land and grassland with the implementation of policies such as “Returning Farmland to Forest and Returning Farmland to Grassland” in 1985–2020 (Dou et al., 2019), leading to significant improvement in habitat quality. The analytical results of land type conversion in Section 2.1 also verify the same results.
Figure 4. Spatial changes in habitat quality from 1985 to 2020.
Habitat quality in the Wuliang section confluence area degraded significantly, especially during 1995–2015, and exhibited a slowly degrading trend after 2015, primarily because a raft of industrial companies began construction along the banks of the Baishinan River before 2015. In Section 2.1, it is also can be seen that an extraordinary amount of land was converted into construction land in the Wuliang section confluence area from 1985 to 2020. On the one hand, original agricultural land was occupied for the construction of industrial companies, forest land, and grassland, causing damage to natural vegetation, and on the other, industrial enterprises that were already built and human activity levels and pollutant emissions in urban land that was developed and expanded accordingly increased significantly compared with previous land types and had an extremely remarkable impact on the surrounding environment (Yuyang et al., 2021). Since 2015, environmental pollution has been effectively controlled, and natural ecosystems have been preliminarily recovered with the implementation of environmental protection policies such as “Water Ten Measure” (Yong, 2021) and “Soil Ten Measures”” (Xiuping and Qinghai, 2016). As a result, habitat quality showed a slowly degrading trend.
Habitat quality changes in Peihui and Sangliushu section confluence areas are not significant, primarily because these areas are agricultural production areas with agricultural land as the mainland type all the time and less conversion of other types of land. With the advancement in environmental protection work and successive implementation of rural revitalization and river ecosystem restoration projects, habitat quality increased. For the Ciyao River Basin, the construction of industrial companies and urbanization progress caused considerable land conversion into construction land, leading to a decrease in habitat quality levels. Although habitat quality in the area of the source of rivers was improved to some extent with the implementation of policies such as returning agricultural land to forest, the overall habitat in the basin was still at a low level.
Changes in the hydrology and water quality of rivers
Hydrological changes in rivers
The rainfall levels of the main counties and districts in the Ciyao River Basin are shown in Figure 5. The average annual rainfalls of Jiaocheng County, Wenshui County, Fenyang Municipality, and Xiaoyi Municipality in 2005–2019 were 575.5 mm, 509.6 mm, 506.2 mm and 526.1 mm, and up 20.9 mm, 16.6 mm 17.8 mm and 39.6 mm, respectively, compared with those of the years 1956–2000. From Figure 5, it can be observed that the precipitation of the Ciyao River Basin in 2005–2019 fluctuated, and changes in various counties and districts were consistent.
Figure 5. Rainfall of main counties and districts in Ciyao River Basin from 2005 to 2019.
We used the Mann–Kendall (MK) test to analyze precipitation data of main counties and municipalities in the Ciyao River Basin during 2005–2019 (Ali et al., 2019; Ali and Abubaker, 2019; Zhao et al., 2020). The Z value is the standardized test statistics. If Z > 0, it indicates an increasing trend and vice versa. If the absolute value of Z is greater than 1.96, it means that trends have passed the significance test with a significance level of 95%.
The results show that the value of statistics Z of precipitation in various counties and districts is greater than 0, which indicates that the precipitation shows an increasing trend. However, the absolute value of Z is less than 1.96. It is impossible to pass the significance test with a confidence level of 95%, which means the increasing trend of precipitation in the Ciyao River Basin is insignificant.
Changes in the number of water resources and the runoff depth of the Ciyao River are shown in Figure 6. We analyzed the total amount of water resources and annual runoff depth of the Ciyao River in 2005–2019 with the MK trend test. The statistics Z of the total amount of water resources and annual runoff depth is 2.18 and 4.01, respectively, and both are greater than 1.96, which means that the total amount of water resources and annual runoff depth of the Ciyao River in 2005–2019 showed a significant increasing trend (Table 6). From the paragraph above, it can be seen that the precipitation of 2005–2019 did not show a significant increasing trend, and based on data investigation, it can be seen that no projects such as trans-regional water transfer were implemented in the Ciyao River Basin during this period. Therefore, the significant increase in the total amount of its water resources and annual runoff depth might be mainly due to higher water conservation capacity resulting from improved habitat quality in the area of the river’s source.
Table 6. The Z value of MK test statistical parameter of precipitation change in main counties and regions of Ciyao River Basin from 2005 to 2019.
| Statistics | Jiaocheng county | Wenshui county | Fenyang county | Xiaoyi municipality | Average rainfall of the four counties |
|---|---|---|---|---|---|
| Z | 1.39 | 1.19 | 0.49 | 0.79 | 1.09 |
Figure 6. Variation of water resources and runoff depth in Ciyao River Basin from 2005 to 2019.
Analysis of water quality in the river
From the results of water quality monitoring of various sections (Figure 7), it can be seen that the water quality in the Ciyao River in 2016–2020 showed an overall trend of getting better year over year overall. It was superior to Class V surface water quality in 2020 (Appendix 1), except in the Meijinqiao section. Habitat quality in various regions in the Ciyao River Basin improved to varying degrees. The increase in the water quality of the river is due to, on the one hand, more stringent requirements for environmental pollution control, such as the Plan for Special Campaign against Water Pollution in the Ciyao River under Public Supervision issued by Shanxi province in 2019, which required that chemical oxygen demand (COD), ammonia nitrogen, and total phosphorus (TP) in effluent meet Class V surface water standards and thus caused reduced input of point-source pollutants (Sutadian et al., 2016); and on the other hand due to improved watershed habitat quality that increased the natural flow of the river and a decrease in the input of point-source pollutions. The Meijinqiao section is located at the border between Qingxu County and Jiaocheng County in the Baishinan River. Mass industrial companies and urbanization progress in Qingxu County are the main reason for a higher concentration of ammonia nitrogen in the river (Yang et al., 2019).
Figure 7. Section water quality of Ciyao River Basin from 2016 to 2020.
Conclusions
This study was designed to investigate the water quality of the Ciyao River Basin and the effects of various factors, such as land use, through ArcGIS and InVEST models. The areas with improved habitat quality in the Ciyao River Basin were mainly concentrated in the area of the river source. Habitat quality in the Wuliang section confluence area degraded greatly from 1995 to 2015, and changes in Peihui and Sangliushu section confluence areas were not significant.
Due to the improved habitat quality in the area of the river’s source, water conservation capacity increased. The total amount of water resources and the runoff depth of the Ciyao River in 2005–2019 went up remarkably. Due to more stringent environmental governance requirements and improved habitat quality, the water quality in the Ciyao River in 2016–2020 increased year over year. The water quality in all sections except the Meijinqiao section in 2020 exceeded Class V surface water standards. Therefore, it is recommended to continuously monitor the concentration of pollutants in the Ciyao River, especially in the Meijinqiao section, and try to reduce the sources of pollution. It is also recommended to determine the contribution of resource pollution of the Ciyao River in future studies so that the water quality can be increased by more accurate management of sources of water pollution, especially in the Meijinqiao section.
Competing Interests
The authors declare that they have no conflict of interest to report.
Availability of Data
The authors can be contacted for data requests.
Funding
This study was supported by the Key R&D Program of Shanxi Province (201903D311004), Applied Basic Research Program of Shanxi Province (201801D221335), and Top Young Talent Support Program of Shanxi Province.
REFERENCES
Aiguo, H., Peng, C. and Nan, W., 2020. Response of regional habitat quality to land cover change based on InVEST Model—a case study of Hefei City. Anhui Agricultural Science Bulletin 26: 7–18.
Ali, R., Kuriqi, A., Abubaker, S. and Kisi, O., 2019. Long-term trends and seasonality detection of the observed flow in Yangtze River using Mann-Kendall and Sen’s innovative trend method. Water 11(9): 1855. 10.3390/w11091855
Ali, R.O. and Abubaker, S.R., 2019. Trend analysis using Mann–Kendall, Sen’s slope estimator test and innovative trend analysis method in Yangtze River Basin, China. International Journal of Engineering & Technology 8(2): 110–119. 10.14419/ijet.v7i4.29591
Bagstad, K.J., Villa, F., Johnson, G.W. and Voigt, B., 2011. Artificial intelligence for ecosystem services. A guide to models and data, version 1.0. ARIES report series n.1, Geneva, Switzerland, pp. 129–142.
Bai, B., Bai, F., Li, X., Nie, Q., Jia, X. and Wu, H., 2022. The remediation efficiency of heavy metal pollutants in water by industrial red mud particle waste. Environmental Technology & Innovation 28: 102944. 10.1016/j.eti.2022.102944
Bao, Y., Liu, K., Li, T. and Hu, S., 2015. Effects of land use change on habitat based on InVEST model—taking Yellow River Wetland Nature Reserve in Shaanxi Province as an example. Arid Zone Research 32(3): 622–629.
Berta Aneseyee, A., Noszczyk, T., Soromessa, T. and Elias, E., 2020. The InVEST habitat quality model associated with land use/cover changes: a qualitative case study of the Winike Watershed in the Omo-Gibe Basin, Southwest Ethiopia. Remote Sensing 12(7): 1103. 10.3390/rs12071103
Boumans, R. and Costanza, R., 2007. The Multiscale Integrated Earth Systems model (MIMES): the dynamics, modeling and valuation of ecosystem services. Issues in Global Water System Research 2(2): 10–11.
Boumans, R., Roman, J., Altman, I. and Kaufman, L., 2015. The Multiscale Integrated Model of Ecosystem Services (MIMES): simulating the interactions of coupled human and natural systems. Ecosystem Services 12: 30–41. 10.1016/j.ecoser.2015.01.004
Chen, F., Ma, J., Zhu, Y., Li, X., Yu, H. and Sun, Y., 2022. Biodegradation performance and anti-fouling mechanism of an ICME/electro-biocarriers-MBR system in livestock wastewater (antibiotic-containing) treatment. Journal of Hazardous Materials 426: 128064. 10.1016/j.jhazmat.2021.128064
Chen, X., Quan, Q., Zhang, K. and Wei, J. 2021. Spatiotemporal characteristics and attribution of dry/wet conditions in the Weihe River Basin within a typical monsoon transition zone of East Asia over the recent 547 years. Environmental Modelling & Software 143(C): 105116. 10.1016/j.envsoft.2021.105116
Chen, Y., Qiao, F. and Jiang, L., 2016. Effects of land use pattern change on regional scale habitat quality based on InVEST model: a case study in Beijing. Acta Scientiarum Naturalium Universitatis Pekinensis 52: 1–10. 10.13209/j.0479-8023.2016.057
Dai, L., Wang, Z., Guo, T., Hu, L., Chen, Y., Chen, C., et al., 2022. Pollution characteristics and source analysis of microplastics in the Qiantang River in southeastern China. Chemosphere 293: 133576. 10.1016/j.chemosphere.2022.133576
Ding, M., Zhao, W., Xu, X., Tang, J., Fan, T., Zhang, L., et al., 2020. Characteristics of organochlorine pollution in the topsoil of the dawen river watershed and potential risk assessment in China. Applied Ecology and Environmental Research 18: 159–172. 10.15666/aeer/1801_159172
Dou, P., Zuo, S., Ren, Y., Dai, S. and Yun, G., 2019. The impacts of climate and land use/land cover changes on water yield service in Ningbo region. Acta Scientiae Circumstantiae 39: 2398–2409. 10.13671/j.hjkxxb.2019.0122
Fang, X., Wang, Q., Wang, J., Xiang, Y., Wu, Y. and Zhang, Y., 2021. Employing extreme value theory to establish nutrient criteria in bay waters: a case study of Xiangshan Bay. Journal of Hydrology 603: 127146. 10.1016/j.jhydrol.2021.127146
Gao, W., Lu, Y. and Qu, X., 2021. River habitat assessment under urbanization: a case study in Shenzhen. Chinese Journal of Ecology 41(22): 8783–8793. 10.5846/stxb202105311426
Ge, D., Yuan, H., Xiao, J. and Zhu, N., 2019. Insight into the enhanced sludge dewaterability by tannic acid conditioning and pH regulation. Science of the Total Environment 679: 298–306. 10.1016/j.scitotenv.2019.05.060
Li, M., Liang, D., Xia, J., Song, J., Cheng, D., Wu, J., et al., 2021. Evaluation of water conservation function of Danjiang River Basin in Qinling Mountains, China based on InVEST model. Journal of Environmental Management 286: 112212. 10.1016/j.jenvman.2021.112212
Li, Y., Li, Q. and Jiu, S. 2022. River health evaluation based on improved analytic hierarchy process, CRITIC method and compound fuzzy matter-element VIKOR model. Journal of Ecology 41: 11–18.
Li, Z., Van Halem, D. and Verberk, J., 2010. Review of high arsenic groundwater in China. 2010 4th International Conference on Bioinformatics and Biomedical Engineering, IEEE. 1–4. 10.1109/ICBBE.2010.5517266
Lin, X., Lu, K., Hardison, A.K., Liu, Z., Xu, X., Gao, D., et al., 2021. Membrane inlet mass spectrometry method (REOX/MIMS) to measure 15N-nitrate in isotope-enrichment experiments. Ecological Indicators 126: 107639. 10.1016/j.ecolind.2021.107639
Liu, Y., Tian, J., Zheng, W. and Yin, L., 2022. Spatial and temporal distribution characteristics of haze and pollution particles in China based on spatial statistics. Urban Climate 41: 101031. 10.1016/j.uclim.2021.101031
Liu, Y., Zhang, K., Li, Z., Liu, Z., Wang, J. and Huang, P., 2020. A hybrid runoff generation modelling framework based on spatial combination of three runoff generation schemes for semi-humid and semi-arid watersheds. Journal of Hydrology 590(2–4): 125440. 10.1016/j.jhydrol.2020.125440
Nan, Y., Binyang, J. and He, J., 2017. Analysis on the 13th Five-Year Environmental Protection Plan. Environmental Protection 45: 4–12.
Ng, C.N., Xie, Y.J. and Yu, X.J., 2011. Measuring the spatio-temporal variation of habitat isolation due to rapid urbanization: a case study of the Shenzhen River cross-boundary catchment, China. Landscape and Urban Planning 103(1): 44–54. 10.1016/j.landurbplan.2011.05.011
NSPRC, 2017. The National Standards of the People’s Republic of China. Environmental quality standards for surface water. Available from: https://english.mee.gov.cn/SOE/soechina1997/water/standard.htm
Peng, X., Mo, S., Li, R., Li, J., Tian, C., Liu, W., et al., 2021. Effective removal of the rare earth element dysprosium from wastewater with polyurethane sponge-supported graphene oxide–titanium phosphate. Environmental Chemistry Letters 19(1): 719–728. 10.1007/s10311-020-01073-y
Quan, Q., Gao, S., Shang, Y. and Wang, B., 2021. Assessment of the sustainability of Gymnocypris eckloni habitat under river damming in the source region of the Yellow River. Science of the Total Environment 778: 146312. 10.1016/j.scitotenv.2021.146312
Redhead, J., Stratford, C., Sharps, K., Jones, L., Ziv, G., Clarke, D., et al., 2016. Empirical validation of the InVEST water yield ecosystem service model at a national scale. Science of the Total Environment 569: 1418–1426. 10.1016/j.scitotenv.2016.06.227
Redhead, J.W., May, L., Oliver, T.H., Hamel, P., Sharp, R. and Bullock, J.M., 2018. National scale evaluation of the InVEST nutrient retention model in the United Kingdom. Science of the Total Environment 610: 666–677. 10.1016/j.scitotenv.2017.08.092
Sala, O.E., Stuart Chapin, F., Armesto, J.J., Berlow, E., Bloomfield, J., Dirzo, R., et al., 2000. Global biodiversity scenarios for the year 2100. Science 287(5459): 1770–1774. 10.1126/science.287.5459.1770
Shengkai, X., Yunjie, Z., Zh, Y., Guowen L. and Qiujin, X., 2022. Research on ecological construction scheme of the shoreline buffer zone of the mainstream of the Yangtze River: take the Jiangyin Section of the Yangtze River as an example. Journal of Environmental Engineering Technology 12(2): 581–589. 10.12153/j.issn.1674-991X.20210664
Sushi, L., 2020. Evaluation of habitat quality in Tianfu new arb based on CLUE-S and InVEST models. Chengdu University of Technology: MDIP, pp. 27–31.
Sutadian, A.D., Muttil, N., Yilmaz, A.G. and Perera, B., 2016. Development of river water quality indices—a review. Environmental Monitoring and Assessment 188(1): 1–29. 10.1007/s10661-015-5050-0
Tan, Z., Dong, B., Xing, M., Sun, X., Xi, B., Dai, W., et al., 2022a. Electric field applications enhance the electron transfer capacity of dissolved organic matter in sludge compost. Environmental Technology: (12):1–11. 10.1080/09593330.2022.2107951
Tan, Z., Zhu, H., He, X., Xi, B., Tian, Y., Sun, X., et al., 2022b. Effect of ventilation quantity on electron transfer capacity and spectral characteristics of humic substances during sludge composting. Environmental Science and Pollution Research. 29(46): 70269–70284. 10.1007/s11356-022-20808-8
Terrado, M., Sabater, S., Chaplin-Kramer, B., Mandle, L., Ziv, G. and Acuña, V., 2016. Model development for the assessment of terrestrial and aquatic habitat quality in conservation planning. Science of the Total Environment 540: 63–70. 10.1016/j.scitotenv.2015.03.064
Tian, H., Qin, Y., Niu, Z., Wang, L. and Ge, S., 2021. Summer maize mapping by compositing time series sentinel-1A imagery based on crop growth cycles. Journal of the Indian Society of Remote Sensing 49: 2863–2874. 10.1007/s12524-021-01428-0
Villa, F., Ceroni, M., Bagstad, K., Johnson, G. and Krivov, S., 2009. ARIES (Artificial Intelligence for Ecosystem Services): a new tool for ecosystem services assessment, planning, and valuation. Proceedings of the 11th Annual BIOECON Conference on Economic Instruments to Enhance the Conservation and Sustainable Use of Biodiversity, Venice, Italy, 2009. pp. 21–22.
Wan, Z., Zhang, T., Liu, Y., Liu, P., Zhang, J., Fang, L., et al., 2022. Enhancement of desulfurization by hydroxyl ammonium ionic liquid supported on active carbon. Environmental Research 213: 113637. 10.1016/j.envres.2022.113637
Wang, Q., Wu, S., Cui, D., Zhou, H., Wu, D., Pan, S., et al., 2022. Co-hydrothermal carbonization of organic solid wastes to hydrochar as potential fuel: a review. Science of the Total Environment 850: 158034. 10.1016/j.scitotenv.2022.158034
Wang, Y.-S., Lou, Z.-P., Sun, C.-C. and Sun, S., 2008. Ecological environment changes in Daya Bay, China, from 1982 to 2004. Marine Pollution Bulletin 56(11): 1871–1879. 10.1016/j.marpolbul.2008.07.017
Wang, Z., Li, Y. and Luo, J., 2020. Spatio-temporal evolution of habitat quality in the Nenjiang River Basin, Northeast China. Environmental Ecology 2: 8–12.
Wanghe, K., Guo, X., Ahmad, S., Tian, F., Nabi, G., Strelnikov, I.I., et al., 2022. FRESF model: An ArcGIS toolbox for rapid assessment of the supply, demand, and flow of flood regulation ecosystem services. Ecological Indicators 143: 109264. 10.1016/j.ecolind.2022.109264
Wilson, M.C., Chen, X.-Y., Corlett, R.T., Didham, R.K., Ding, P., Holt, R.D., et al., 2016. Habitat fragmentation and biodiversity conservation: key findings and future challenges. Landscape Ecology 31: 219–227. 10.1007/s10980-015-0312-3
Wu, X., Liu, Z., Yin, L., Zheng, W., Song, L., Tian, J., et al., 2021. A haze prediction model in Chengdu based on LSTM. Atmosphere 12: 1479. 10.3390/atmos12111479
Xiuping, G. and Qinghai, G., 2016. Soil pollution action plan and soil pollution control. Ecological Economy 32: 4–12.
Xu, J., Lan, W., Ren, C., Zhou, X., Wang, S. and Yuan, J., 2021. Modeling of coupled transfer of water, heat and solute in saline loess considering sodium sulfate crystallization. Cold Regions Science and Technology 189: 103335. 10.1016/J.COLDREGIONS.2021.103335
Yang, J.-R., Wang, Y., Chen, H. and Lyu, Y.-K., 2019. Ammonium removal characteristics of an acid-resistant bacterium Acinetobacter sp. JR1 from pharmaceutical wastewater capable of heterotrophic nitrification-aerobic denitrification. Bioresource Technology 274: 56–64. 10.1016/j.biortech.2018.10.052
Yang, Y., Li, T., Wang, Y., Cheng, H., Chang, S.X., Liang, C., et al., 2021. Negative effects of multiple global change factors on soil microbial diversity. Soil Biology and Biochemistry 156: 108229. 10.1016/j.soilbio.2021.108229
Yaqian, C., Li, Z., Jinyuan, T. and Zhang, P., 2020. Habitat quality evaluation before and after unused land development based on InVEST model: a case study of Tang County. Chinese Journal of Eco-Agriculture 28(7): 1093–1102. 10.13930/j.cnki.cjea.190862
Yin, L., Wang, L., Huang, W., Liu, S., Yang, B. and Zheng, W., 2021. Spatiotemporal analysis of haze in Beijing based on the multi-convolution model. Atmosphere 12: 1408. 10.3390/atmos12111408
Yin, L., Wang, L., Zheng, W., Ge, L., Tian, J., Liu, Y., et al., 2022. Evaluation of empirical atmospheric models using Swarm-C satellite data. Atmosphere 13: 294. 10.3390/atmos13020294
Yingming, L., 2004. Shanxi rivers. Science Press 5: 25–35.
Yong, Z., 2021. The action plan for prevention and treatment of water pollution to control water pollution. Journal of Water Process Engineering 25: 125–135.
Yuyang, C., Yang, G. and Zhen, X., 2021. Spatiotemporal evolution and spatial correlation of habitat quality and landscape pattern over Beijing-Tianjin-Hebei region. Chinese Environmental Science 41: 848–859.
Zhang, H., Wu, F., Zhang, Y., Han, S. and Liu, Y., 2019a. Spatial and temporal changes of habitat quality in Jiangsu Yancheng Wetland National Nature Reserve—Rare birds of China. Applied Ecology and Environmental Research 17: 4807–4821. 10.15666/aeer/1702_48074821
Zhang, K., Wang, S., Bao, H. and Zhao, X., 2019b. Characteristics and influencing factors of rainfall-induced landslide and debris flow hazards in Shaanxi Province, China. Natural Hazards and Earth System Sciences 19: 93–105. 10.5194/nhess-19-93-2019
Zhang, X., Ma, F., Dai, Z., Wang, J., Chen, L., Ling, H., et al., 2022a. Radionuclide transport in multi-scale fractured rocks: a review. Journal of Hazardous Materials 424: 127550. 10.1016/j.jhazmat.2021.127550
Zhang, X., Ma, F., Yin, S., Wallace, C.D., Soltanian, M.R., Dai, Z., et al., 2021. Application of upscaling methods for fluid flow and mass transport in multi-scale heterogeneous media: A critical review. Applied Energy 303: 117603. 10.1016/j.apenergy.2021.117603
Zhang, X., Zhou, J., Li, G., Chen, C., Li, M. and Luo, J., 2020. Spatial pattern reconstruction of regional habitat quality based on the simulation of land use changes from 1975 to 2010. Journal of Geographical Sciences 30(4): 601–620. 10.1007/s11442-020-1745-4
Zhang, Y., Zhang, C., Zhang, X., Wang, X., Liu, T., Li, Z., et al., 2022b. Habitat quality assessment and ecological risks prediction: an analysis in the Beijing–Hangzhou Grand Canal (Suzhou section). Water 14: 2602. 10.3390/w14172602
Zhao, S., Fan, W. and Yu, N., 2020. Analysis of annual precipitation in the Dongzhi tableland based on wavelet and MK tests. Journal of Hebei University of Technology 37: 7–12. 10.3969/j.issn.1673-9469.2020.01.014
Zhao, S., Li, H., Wang, B., Yang, X., Peng, Y., Du, H., et al., 2022. Recent advances on syngas conversion targeting light olefins. Fuel 321(2): 124124. 10.1016/j.fuel.2022.124124
Zhao, T., Shi, J., Entekhabi, D., Jackson, T.J., Hu, L., Peng, Z., et al., 2021. Retrievals of soil moisture and vegetation optical depth using a multi-channel collaborative algorithm. Remote Sensing of Environment 257: 112321. 10.1016/j.rse.2021.112321
Appendix 1. Surface water quality classification (1).
| Class I | Mainly applicable to the water from sources, and the national nature reserves. |
| Class II | Mainly applicable to first class of protected areas for centralized sources of drinking water, the protected areas for rare fishes, and the spawning fields of fishes and shrimps. |
| Class III | Mainly applicable to second class of protected areas for centralized sources of drinking water, protected areas for the common fishes and swimming areas. |
| Class IV | Mainly applicable to the water areas for industrial use and entertainment, which are not directly touched by human bodies. |
| Class V | Mainly applicable to the water bodies for agricultural use and landscape requirement. |